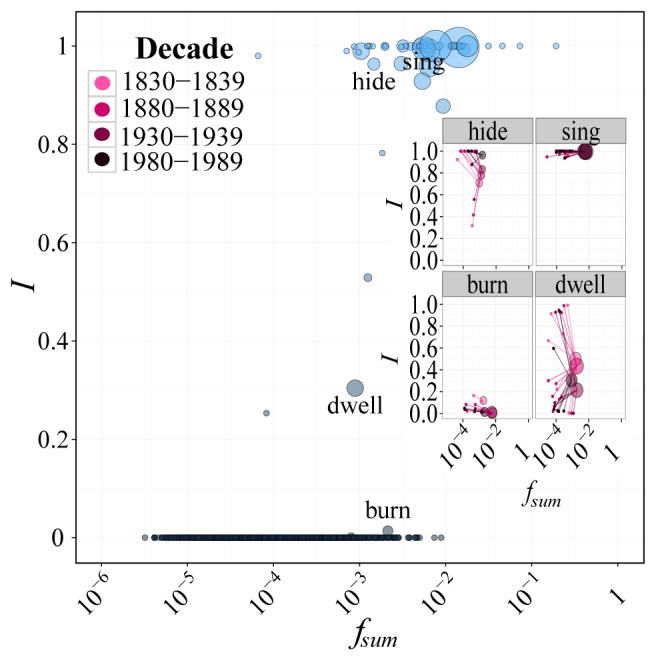
Figure 4. Plot of the proportion of irregularity,  , for phonological classes against
  , the sumed frequencies of members in a class.

The main plot refers to the last decade (1980–1989) and, along with classes, shows regular roots in the decade (grey points at the bottom). For each unclassed regular root, the same values of  and
and  are used as in Fig. 2A. The size of the circle for each class is proportional to the number of members in the class. The insets show four exemplars of classes with different behaviours, in four time snapshots (identified with a purple hue going from light to dark with increasing time): the largely irregular hide and sing classes on the top, and the regularizing burn and dwell classes on the bottom. Small points in the insets are the member roots of the class (with their values of
  and
and  ), connected with lines to the class itself. The relationship between variance of
  within a class and its stability is visible especially in the “star-like” quality of the dwell class. The plot shows that even basic phonological classification makes the frequency/regularity relationship clearer, as compared to Fig. 2A.
