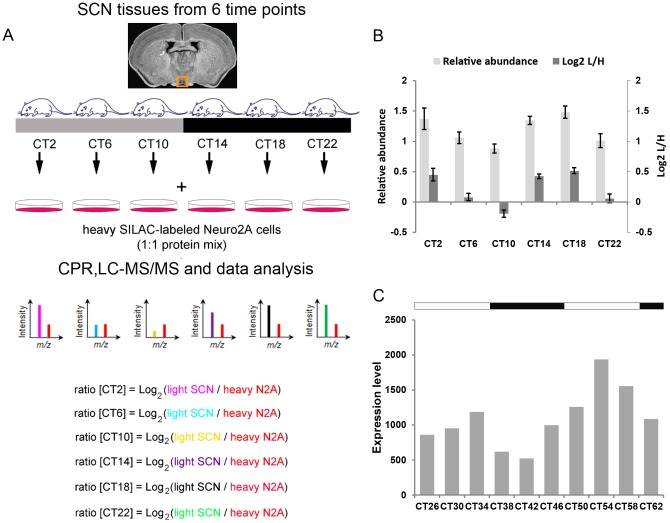
Figure 1. Proteomic analysis of UBR4 in the murine SCN.
(A) Schematic overview of the centrifugal proteomic reactor (CPR) coupled with SILAC-based quantification of the murine SCN proteome. Unlabeled (“light”) protein lysates extracted from the SCN of individual mice (n = 4 per circadian time point) were mixed with equal quantities of protein lysates from “heavy” SILAC-labeled Neuro2A cells. The mixtures were processed by the CPR coupled with HPLC-ESI-MS/MS. Protein abundance in the “light” SCN samples was determined based on relative abundance to the same heavy-labeled peptide in the Neuro2A reference standard. Relative abundance is expressed as the Log2 value of the L/H ratio, where L and H represent light and heavy, respectively. A “ratio of Log2 ratios” provides information on relative changes in protein expression between two time points. (B) Time-of-day-dependent UBR4 expression profile from mass spectrometry analysis. Data are plotted as median values of Log2(L/H) ± SEM (dark gray bars). For ease of interpretation, Log2(L/H) values were converted to relative abundance values and expressed as mean ± SEM (light gray bars). p = 0.013 (1-way ANOVA). (C) UBR4 transcript levels in the murine SCN as detected in a gene expression profiling analysis by Panda et. al. [25]. Data were extracted from circadian expression profile database (CircaDB) (http://circadb.org) [41], dataset: Mouse SCN MAS4 Panda 2002 [25], and replotted as expression level as a function of CT. Tissues were harvested from dark-adapted C57BL/6J mice. White and black bars above the graph indicate the expected light and dark phases, respectively, of the previous LD schedule.

