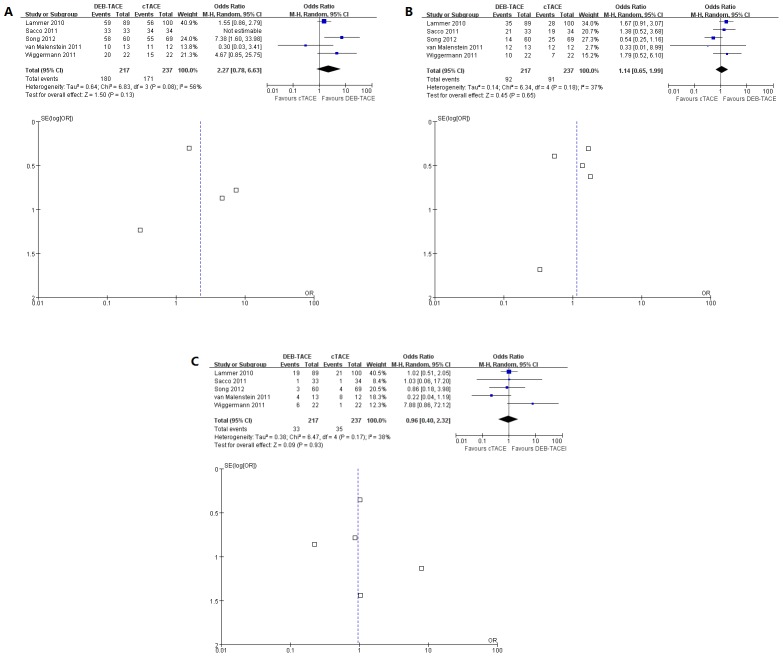
Figure 4.
A. Forest plot comparison of DEB-TACE vs. cTACE group in terms of disease control shows no significance of odds ratio. The Lammer's study takes greater weight against other studies. No publication bias in the funnel plot. B. Forest plot comparison of DEB-TACE vs. cTACE group in terms of complications show there is no significance of odds ratio and no publication bias. C. Forest plot comparison of severe complications show there is no significance of odds ratio between these two groups and report no publication bias.

