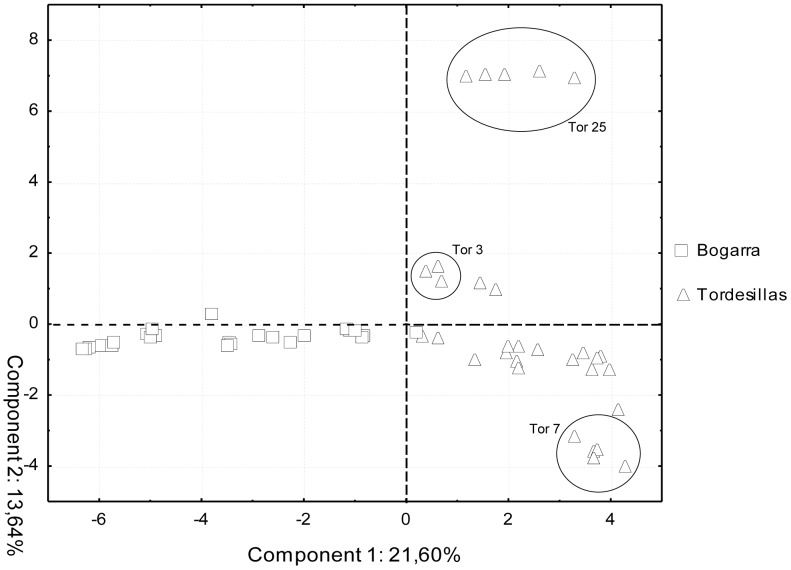
Figure 4. Two dimensional PCA scatter plot for population differentiation.
Principal Components was performed to analyze samples belonging to Tordesillas and Bogarra populations using MSAPs with significant epigenetic effect differentiating populations and propagated trees. Bogarra ramets are identified by squares and Tordesillas ramets by triangles. Propagated trees which ramets clustered together are highlighted with circles. First component (X axis) gathers 21.60% of the variation and second component (Y axis) 13.64.

