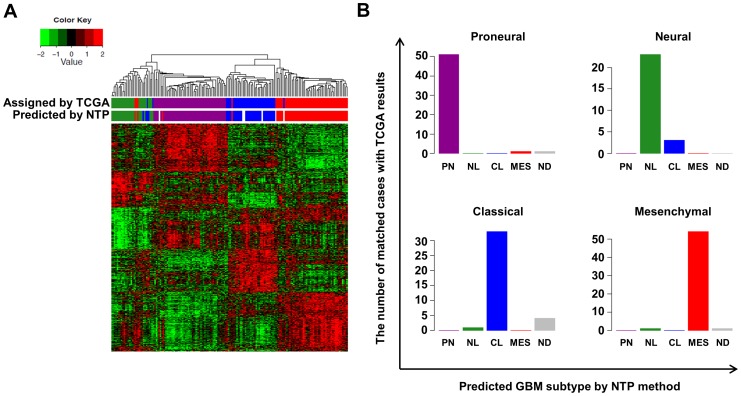
Figure 1. The ‘NTP method’ predicting GBM subtypes.
(A) Hierarchical clustering using expression of 840 genes of 173 TCGA core GBM samples. The hierarchical clustering results were compared with the results of the NTP method (Predicted by NTP) and the previous reports by TCGA (Assigned by TCGA). Green, purple, blue, and red = neural (NL), proneural (PN), classical (CL), and mesenchymal (MES) subtype, respectively. (B) Subtype classification by the NTP methods was compared with corresponding subtypes assigned by TCGA. ND = not-determined.

