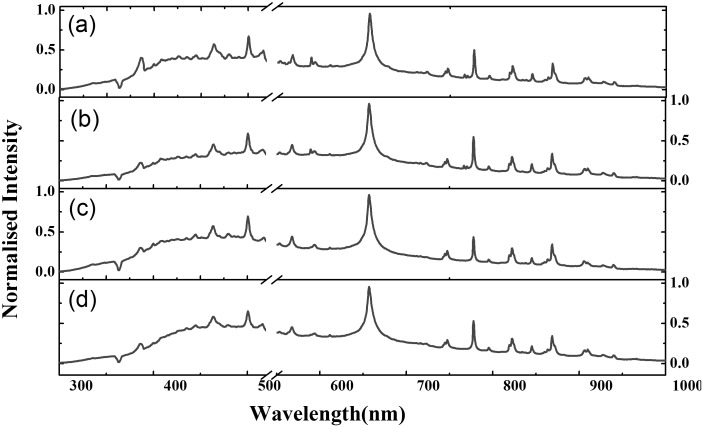
Figure 1. Representative LIBS spectra acquired from the pharmaceutical formulation investigated in this report.
(a) Cetirizine dihydrochloride; (b) Cipro pure; (c) Metformin hydrochloride; (d) Ciprofloxacin hydrochloride. Intensity on the y-axis is normalized with respect to the characteristic hydrogen emission peak at 656 nm.

