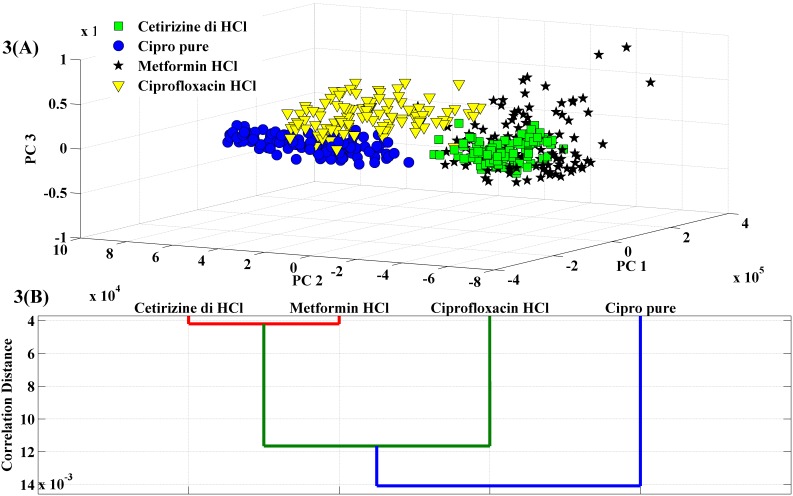
Figure 3. Discrimination of pharmaceutical samples based on their LIBS spectra.
(A) Scores plot corresponding to principal components 1, 2 and 3 for the spectral dataset acquired from the four samples. The data points corresponding to Cetirizine dihydrochloride, Cipro pure, Metformin hydrochloride and Ciprofloxacin hydrochloride are indicated by green squares, blue circles, black asterisks and yellow inverted triangles, respectively. (B) Hierarchical clustering using the dendrogram representation for LIBS spectra acquired from the 4 sets of pharmaceutical samples.

