
Figure 1. The graphical model and generative story for ATAM.
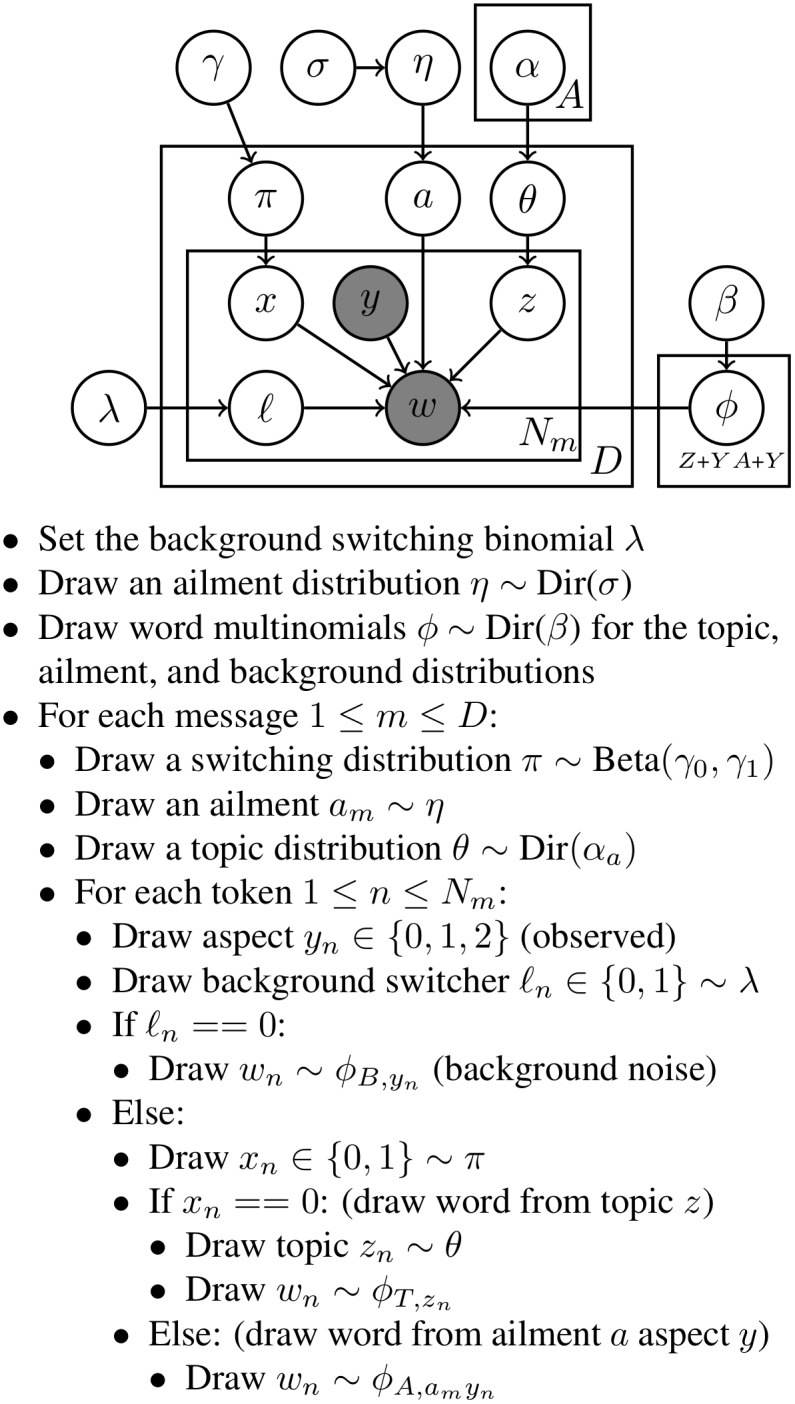
The graphical model representation of ATAM using plate notation, followed by the “generative story” description of the model. In the graphical model, the variable z denotes the topic index, and the Bernoulli variables x and ℓ are switch variables indicating whether a word is an ailment or topic word and whether a word is background noise. These three variables do not appear in the conditional likelihood because they have been summed out. A is the number of ailments, Y is the number of aspects, Z is the number of topics, D is the number of documents, and Nm is the number of tokens in document m. In the generative description, “Dir” refers to the Dirichlet distribution.