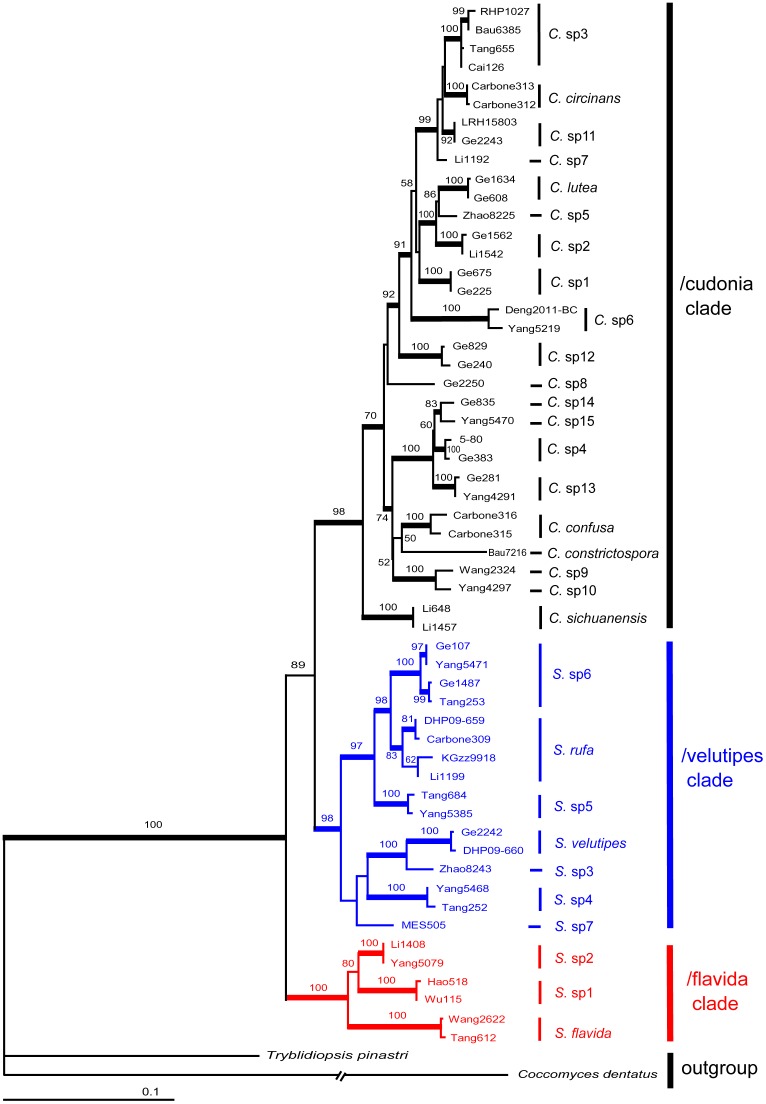
Figure 3. Four-locus (ITS, nrLSU, rpb2 and tef-1α) maximum likelihood (ML) phylogeny depicting phylogenetic relationships among 58 sequences of Cudonia and Spathularia.
Bootstrap support values from ML (1000 bootstrap replicates) analyses are shown above the internal branches. Bayesian posterior probabilities (BPP) greater than 0.95 are indicated by thickened branches. Branch lengths are proportional to the average number of substitutions per site except for dashed lines, which indicate longer branches that are not shown to scale.

