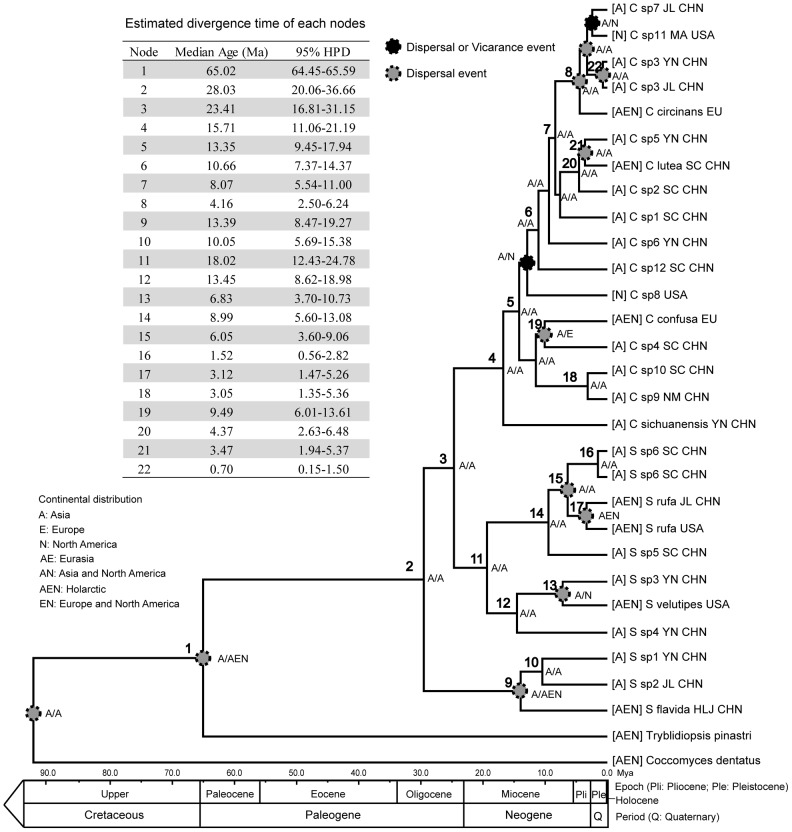
Figure 4. Ancestral area reconstruction and chronogram of clade of Cudonia and Spathularia based on BEAST analyses using Cudonia stem (65.03 ± 0.29 MYA, node 1) as calibration.
Estimated mean divergence times and 95% highest posterior density of resolved nodes in phylogenetic analyses are summarized in the upper left panel. Geological time scale according to Gradstein et al. (2004) is shown along the bottom for scale.

