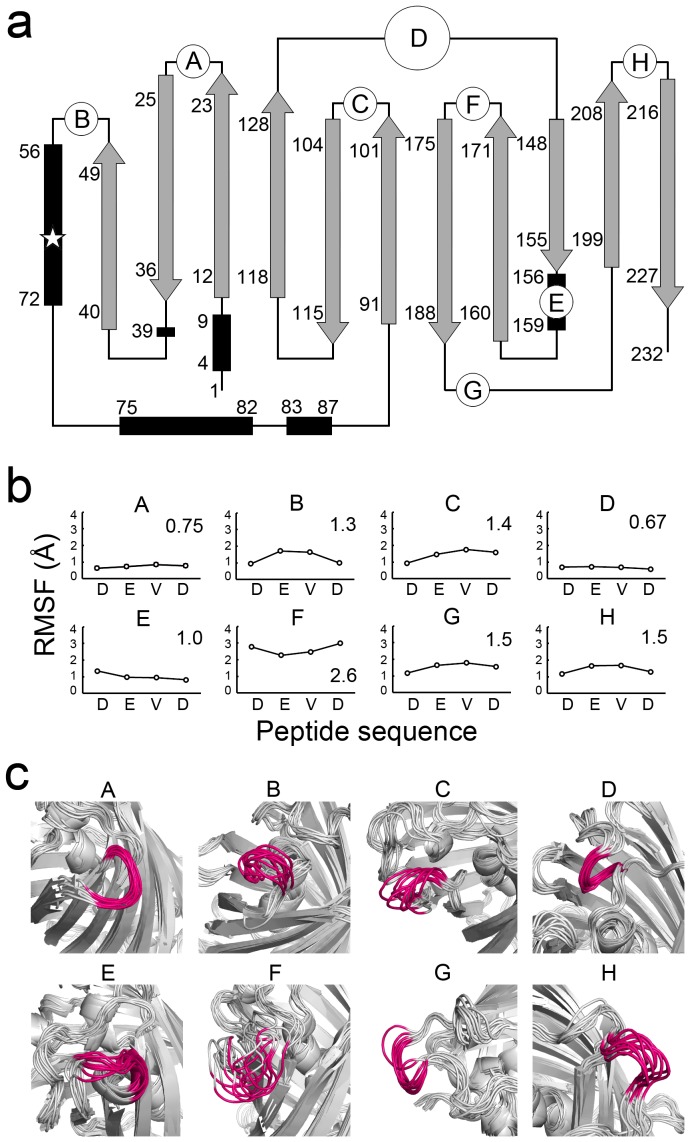
Figure 1. Fluctuation of integrated peptides.
(a) A topology diagram of sfGFP. β-strands, α-helices, and the chromophore are represented by gray arrows, black rectangles, and a white star, respectively. The DEVD peptide was integrated into the A (D23/G24), B (G51/K52), C (D102/D103), D (G134–L137), E (Q157/K158), F (D173/G174), G (G189/D190), and H (E213/K214) sites. (b) Root mean square fluctuation (RMSF) of the integrated peptides. The RMSF values represent the atomic fluctuations of each residue throughout 4.5–9.0 ns trajectories. Average fluctuation distances are also indicated. (c) Superimposed structures at every 0.5 ns throughout the 4.5–9.0 ns trajectory for mutant proteins in MD simulations. The integrated peptides are highlighted in magenta.

