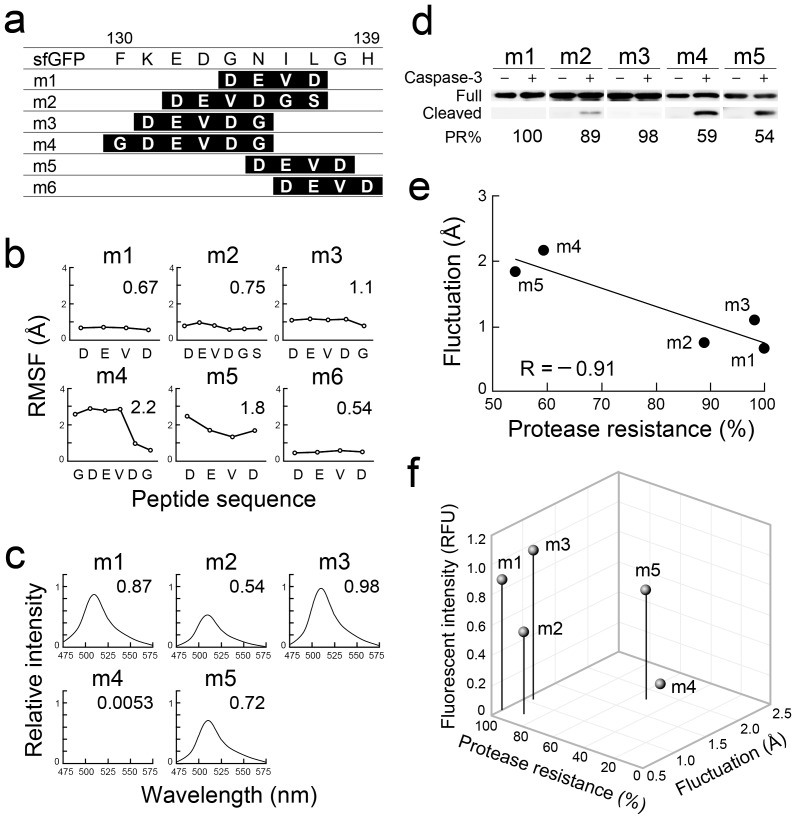
Figure 2. Analysis of sfGFP mutants with peptide integration around site D.
(a) Peptide sequences of the sfGFP and mutants. The integration region of each mutant is highlighted in black and the integrated peptide sequences are shown in white letters. (b) Root mean square fluctuation (RMSF) values of peptides sequences of m1–m6 are shown. Average fluctuation distances are also indicated. (c) Fluorescence spectra obtained following excitation at 480 nm (m1–m5). The fluorescence intensity of sfGFP at 510 nm was used as a reference. Relative intensities of mutant proteins are also indicated. (d) Proteolytic resistance of mutants m1–m5. Cleaved fragments were analyzed after 24-h treatment with caspase-3 using western blotting. Protease resistance (PR%) was calculated from the band intensity of cleaved fragments (Cleaved) compared with that of remaining full-length proteins (Full). (e) Linear correlation between the average fluctuation of the integrated peptides and protease resistance. (f) Comparison of sfGFP mutant tolerance based on the position of integration. The relative fluorescent intensity (RFU) at 510 nm compared with that of sfGFP, the protease resistance (%) evaluated using western blotting, and structural fluctuation (Å) of the various peptides calculated by MD simulation are shown.

