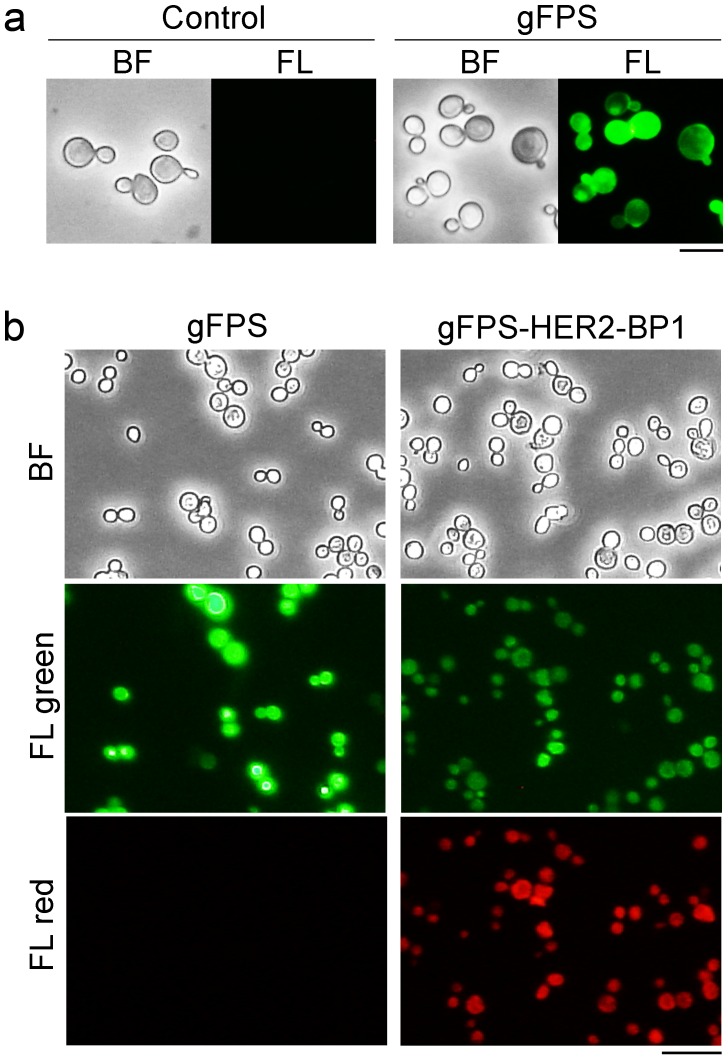
Figure 6. Molecular display of gFPS on the cell surface of yeast.
(a) Bright field (BF) and fluorescence (FL) micrographs of yeast cells harboring empty control (pULD1) or gFPS-displaying plasmids (pULD1-gFPS). Bar = 10 µm (b) BF, green fluorescence (FL green), and red fluorescence (FL red) micrographs of gFPS- or gFPS-HER2-BP 1-displaying yeast cells treated with R-HER2-ECD for 3 h. Bar = 20 µm.

