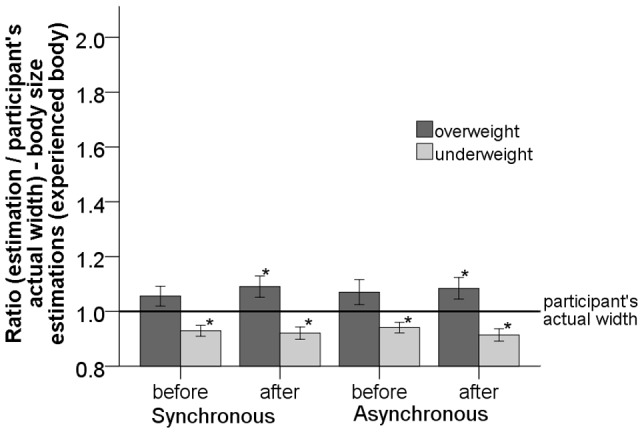
Figure 8. Plot of the ratio of body size estimations for the  body before and after synchronous and asynchronous visual-tactile stimulation.

The asterisk (*) shows the estimations that are significantly different from the participant's actual width. Error bars represent one standard error of the mean.
