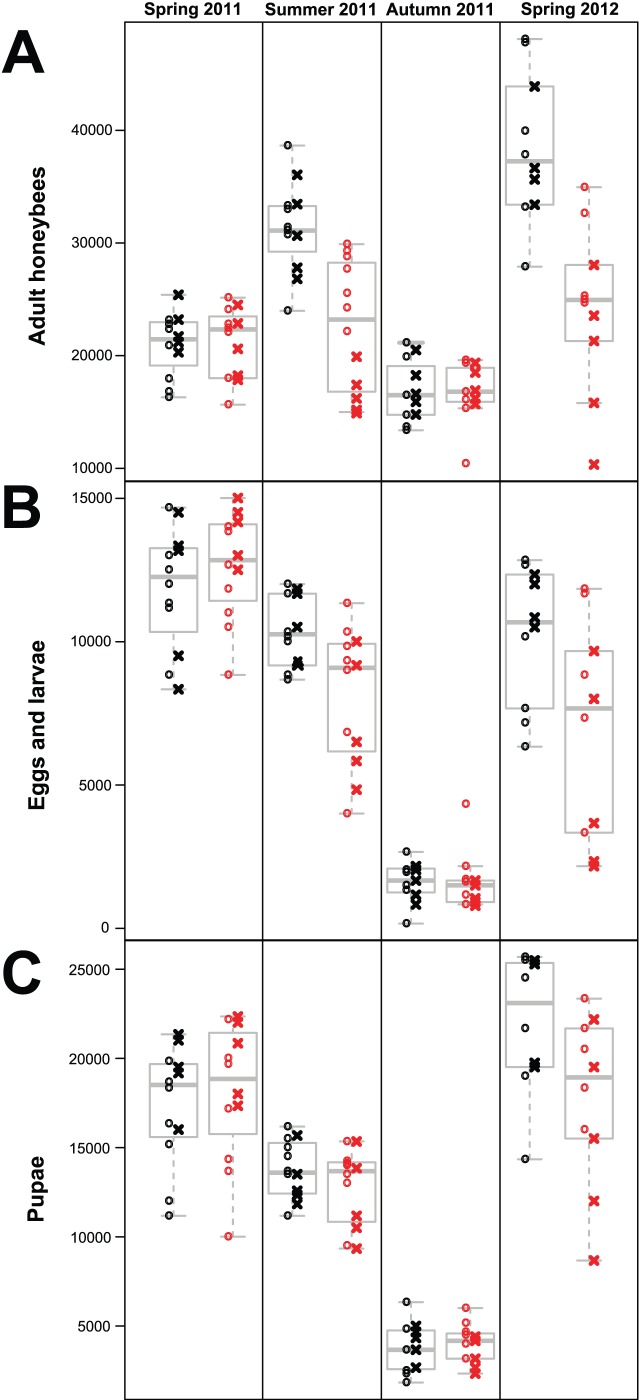
Figure 1. Dynamics of honeybee colony performance.
Data of all three endpoints number of adult bees (A), eggs and larvae (B) and pupae (C) for the different pollen feeding treatments (black = control; red = neonicotinoids) and honeybee strains (circles = strain A; crosses = strain B). The data were obtained at four successive colony assessment dates (X-axis subpanels within figures) performed before (Spring 2011) and directly after the 1.5 months of experimental pollen feeding (Summer 2011), 3.5 months after the treatment (Autumn 2011) and one year later (Spring 2012). Estimated numbers on the Y-axes are truncated for adult bees and pupae for better overview.

