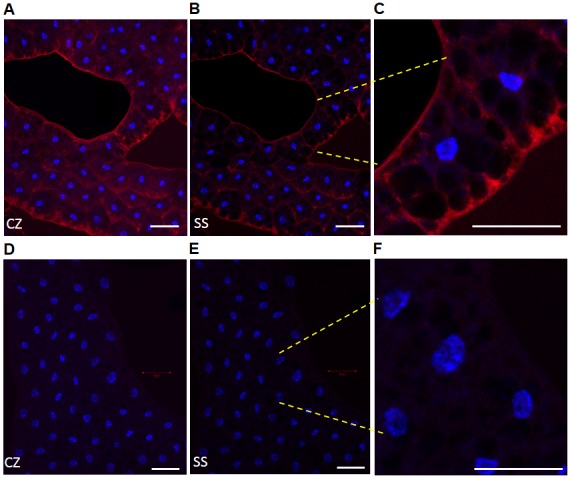
Figure 5. Expression of SID protein in the fat body of 3rd instar larvae.

FB optical sections from control flies were exposed to anti-SID peptide antibody (A–C) and the immune complexes detected with a secondary antibody (goat anti-rabbit) labeled with Alexa Fluor 568. Only FB slices that were incubated with both primary and secondary antibodies (A–C) resulted in Alexa staining (red). Controls FBs that were only incubated with secondary antibody did not show significant staining (D–F). DAP1 (1 µg/ml) was used to localize the nuclei of FB cells (blue). The captured Z-stack images were collapsed (CZ) to visualize the full intensity of the stained FBs (A and D) and compared to a single optical section (SS; B and E). As a reference point for single sections, the section (optical slice) with the brightest nuclear staining was used. White scale bars represent a 50 µm region and shown at the bottom right of each image. Note that images containing a few cells are shown at the right at a higher magnification (C and F; yellow dashes mark region) and all were adjusted to the same level of brightness (+20) to enhance the visualization of the image. Larvae from the control fly line Ubiquitin-GAL4 were used in these studies. Images were captured under the same experimental conditions of micro-channel plate (MCP) gain and laser power output via a confocal fluorescence LSM 700 microscope.
