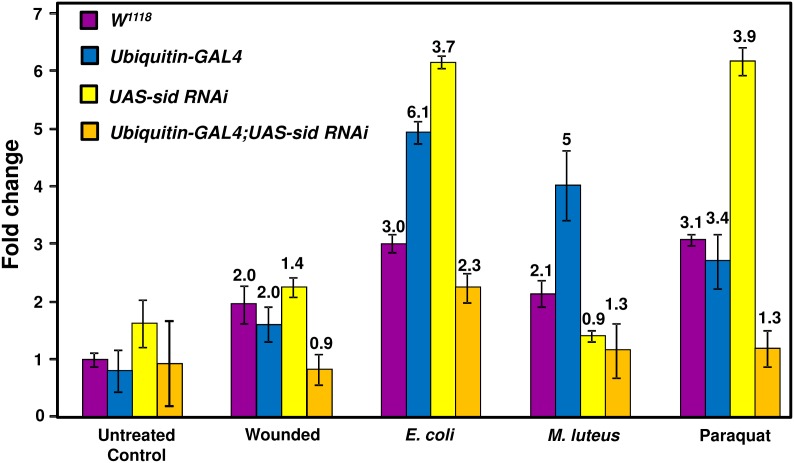
Figure 6. Analysis of sid expression levels in untreated and infected flies.
Expression of sid was analyzed by qRT-PCR in control (not infected) and flies infected with E. coli flies or M. luteus bacteria. sid expression levels were calibrated to the uninfected w1118 control level, which was assigned an arbitrary value of one. Fold expression (numbers over bars) was determined by dividing the mean value derived from the infected flies by the mean value obtained from uninfected flies (for each line; i.e., W1118 infected over uninfected W1118). RpS15Aa expression values were very similar across all lines and not used to adjust overall expression levels.

