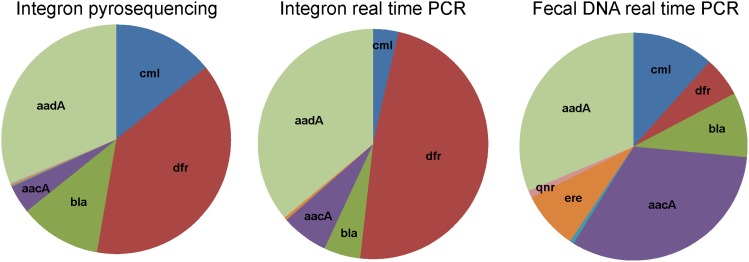
Figure 3. Distribution of selected genes in integron structures determined by pyrosequencing and real-time PCR.
Average values calculated from data available for 48 samples were used for both real-time PCR based pie charts. Quantification of genes in integrons by pyrosequencing and real-time PCR resulted in similar results whereas the comparison of these results with the results from carriage water DNA indicated that dfrA was associated with integrons as its representation decreased when total carriage water was used as a template in real-time PCR. On the other hand, aacA and ereA must have been common in genetic elements different from integrons.

