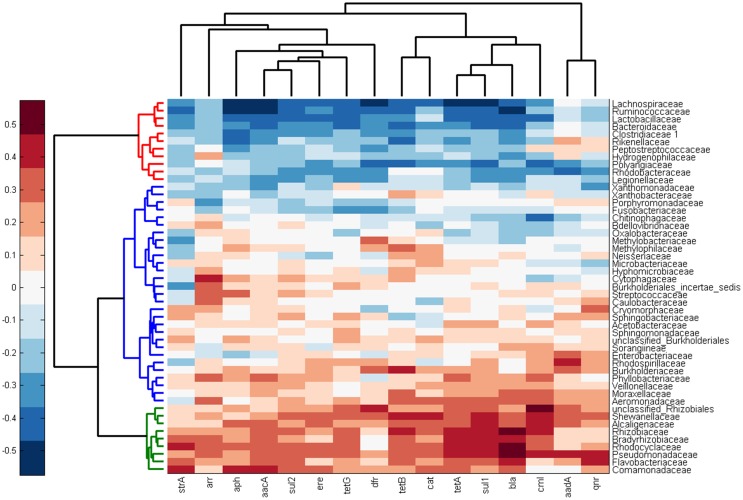
Figure 5. Heat map showing the correlation coefficients of the presence of individual families and particular antibiotic resistance genes.
Three main clusters according to their positive and negative correlation with the prevalence of antibiotic resistance genes tested in this study are indicated by red, blue and green color.

