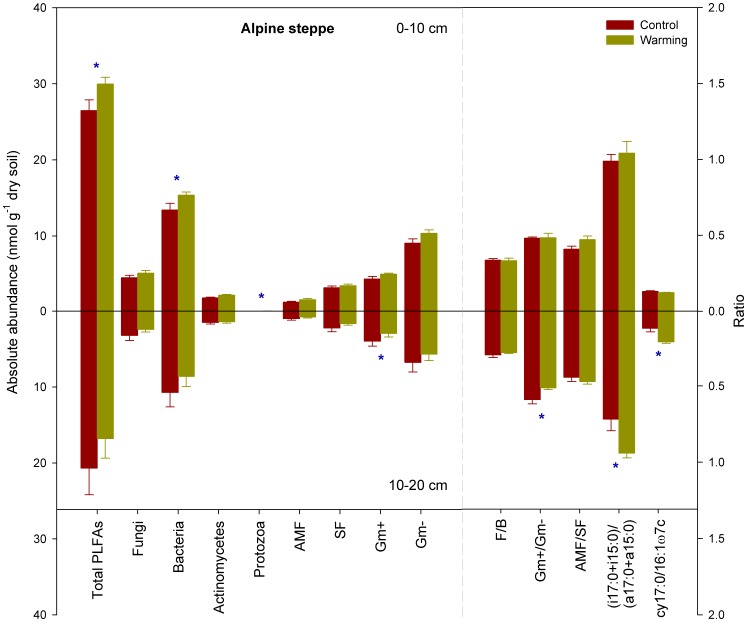
Figure 3. Sums and ratios of various microbial groups in control and warming plots of alpine steppe.
Error bars indicate standard errors. Differences between the control and warming plots were analyzed by two-tailed paired t-tests, indicated by ** for P<0.01 and * for P<0.05. PLFA, phospholipid fatty acid; AMF, arbuscular mycorrhizal fungi; SF, saprotrophic fungi; Gm+, gram-positive bacteria; Gm-, gram-negative bacteria; F/B, the ratio of fungi to bacteria; Gm+/Gm-, the ratio of gram-positive to gram negative bacteria; AMF/SF, the ratio of arbuscular mycorrhizal fungi to saprotrophic fungi.

