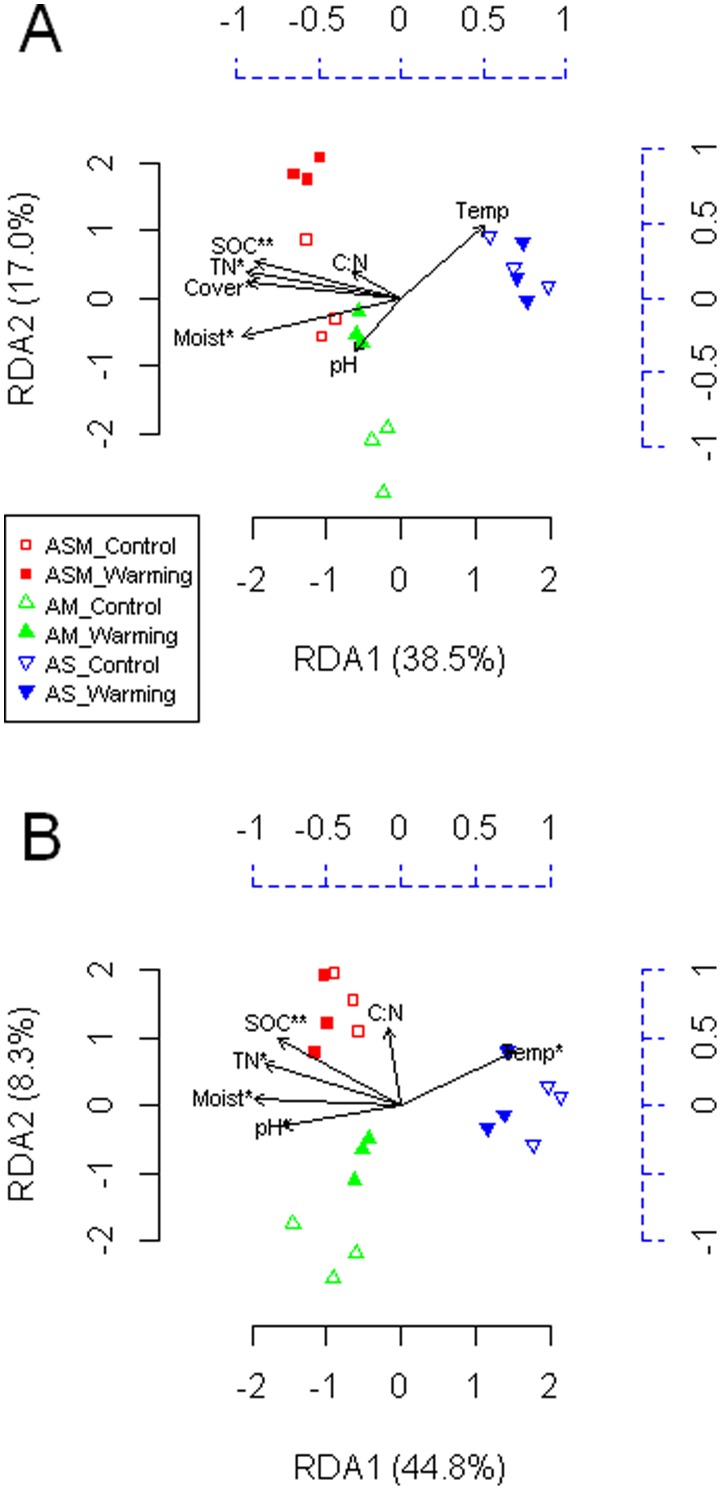
Figure 5. Redundancy analysis (RDA) of the phospholipid fatty acid (PLFA) data as explained by environmental variables.
Seven and six environmental variables were used for the 0–10 (A) and 10–20 cm (B) soil depths, respectively. The PLFA data are scaled by the black solid axes (bottom and left), and the explanatory variables are scaled by the blue dashed axes (top and right). The proportion of explained variation was calculated by using adjusted R-squared values as described by Peres-Neto et al. (2006). The explanatory variables followed by an asterisk indicate significant influences on the PLFA data (*, P<0.05; **, P<0.01). ASM, alpine swamp meadow; AM, alpine meadow; AS, alpine steppe; SOC, soil organic C; TN, total nitrogen; Moist, soil moisture; Temp, soil temperature; Cover, plant coverage.

