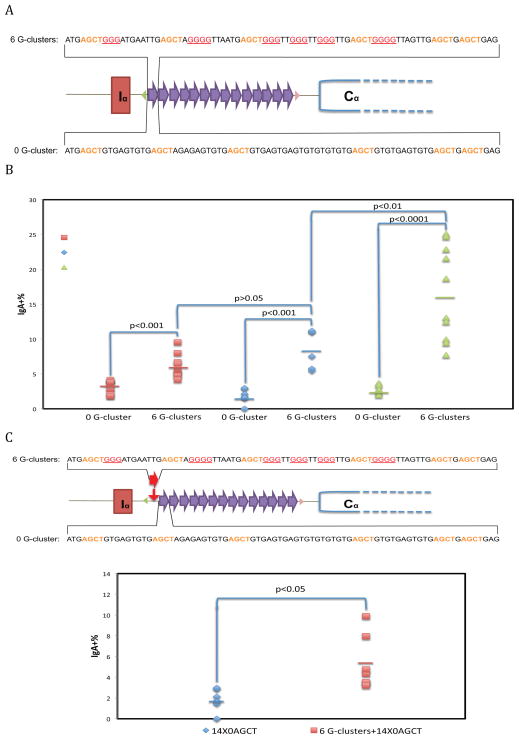
Figure 1. Effect of G-Clusters Interspersed within Switch Repeat Unit.
A. Construction of synthetic switch regions and the genomic configuration of Sα locus (Han et al., 2011). Each 80 bp switch repeat unit (with 6 G-clusters in the DNA sequence shown for the duplex above the diagram or with no G-clusters for the duplex below the diagram) was self-ligated and the products with the desired number of switch repeats were inserted into the exchange vector. An exchange vector and a Cre-expression vector were cotransfected into 1F7 cells. Triangles represent different loxP sties, and each oval represents one 80 bp repeat unit. Six to ten independent cellular clones were made for each switch construct.
B. FACS analysis of CSR is shown. Each data symbol represents an independent clone. The clones are organized in groups of two, based on the number of repeat units shown in the key on the right. The number on the bottom indicates the number of G-clusters within each repeat. The bars represent the mean of each group. The Student’s t test was used to analyze the effect of G-clusters.
C. One 80 bp repeat with 6 G-clusters (the red oval in the top sequence) was cloned immediately upstream of the fourteen 80 bp repeats with no G-clusters (purple ovals that have the DNA sequence shown under the diagram at the top of this panel). Seven independent cellular clones of each switch construct were analyzed by FACS. The horizontal colored bars represent the mean of each group.

