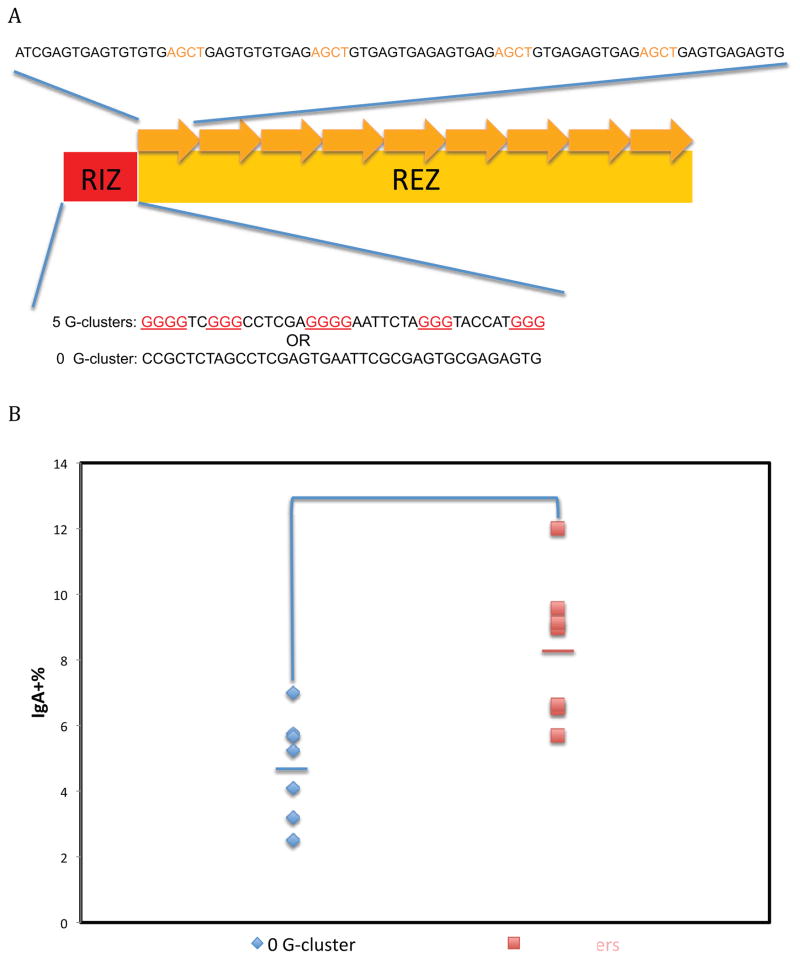
Figure 2. Effect of G-Clusters at the Upstream Boundary of the Class Switch Region.
A. RIZ/REZ configuration of a synthetic switch region. Nine repeats of 80 bp oligonucleotides (top strand of duplex shown above the RIZ/REZ diagram) with 4 AGCT sites (orange) and alternating G nucleotides were used for the REZ in this synthetic switch region. The DNA sequence of the RIZ are shown below the RIZ/REZ diagram, with G-clusters in red. For synthetic switch regions in Figures 2, 4, 5, and 6, the RIZ and REZ are separated, in contrast to Figure 1 where the G-clusters are interspersed with the WGCW sites. The RIZ with zero G-clusters is a negative control for the RIZ with G-clusters.
B. Effect of CSR of G-clusters separate from WGCW motifs. Seven independent cellular clones were shown for each RIZ. The bars represent the mean of each group. The Student’s t test was used to analyze the effect of G-clusters.

