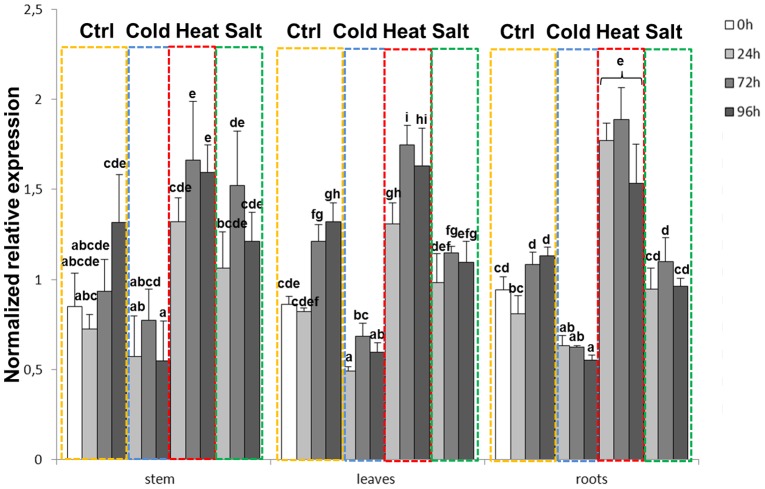
Figure 3. MsSK1 expression in alfalfa tissues under abiotic stresses.
Expression profiles of MsSK1 in the different tissues under abiotic stresses (yellow dotted frame is control; blue dotted frame is cold stress; red dotted frame is heat stress; green dotted frame is salt stress). The Y-axis indicates NRE (Normalized Relative Expression of MtSK1). Data were normalized using ADF1/TFIIA and eIF4A/TFIIA for the roots and stems respectively and TFIIA/eIF4A for the leaves. Means sharing a letter are not significantly different at α = 0.05.

