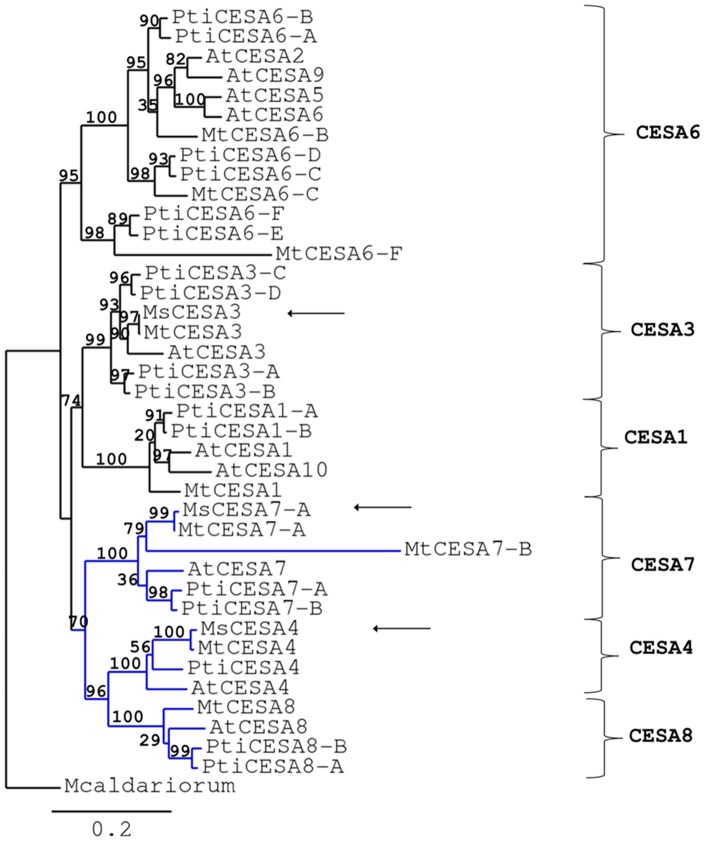
Figure 5. Phylogenetic relationships of CESAs from M. truncatula, M. sativa, P. trichocarpa and A. thaliana by maximum-likelihood analysis.
Bootstrap = 100. Numbers indicate percentage of branch support values. The scale bar indicates an evolutionary distance of 0.2 amino acid substitutions per positions. Mesotaenium caldariorum CESA1 [GenBank: AAM83096] was used as outgroup to root the tree. The branch of secondary CESAs is indicated in blue. Arrows point to the three full-length CESAs identified in M. sativa.

