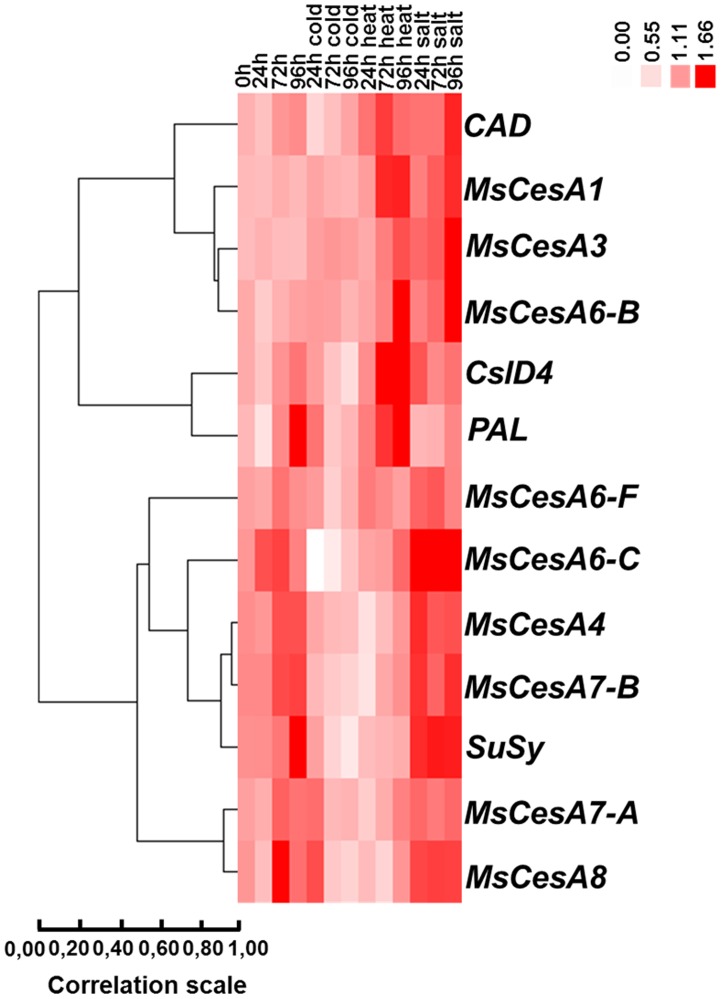
Figure 7. Heat Map representation of the data in Fig. S5 showing the hierarchical clustering of cell wall-related genes in response to the abiotic stresses at the different time points in alfalfa stems.
The data collected refer to 3 independent biological replicates, each consisting of a pool of 15 plants. For each stress treatment a control group was always kept for the 24-48 h-96 h time points, for appropriate comparisons. The group clustering was generated with Cluster 3.0 [38] and visualized with Java TreeView [39], as described in Material and Methods.

