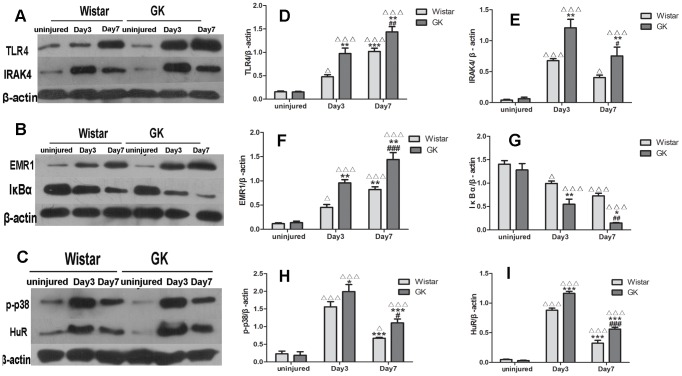
Figure 7. Changes of proteins included in IL-1/TLR-induced NFκB signaling pathway by western blotting analysis invivo.
Representative western blotting of TLR4 and IRAK4 (A), EMR1 and IκBα (B), p-p38 and HuR(C). Bar diagrams depicting the relative protein level of TLR4, IRAK4, EMR1, IκBα, p-p38 and HuR (D, E, F, G, H, I). Data are represented as mean ± SEM. ΔΔΔindicates versus uninjured, p<0.001; *indicates versus Day 3 post-injury, p<0.05, **p<0.01, ***p<0.001; #indicates versus Day 7 post-injury, p<0.05, ##p<0.01, ###p<0.001.

