
Figure 5. No differences in balance beam test.
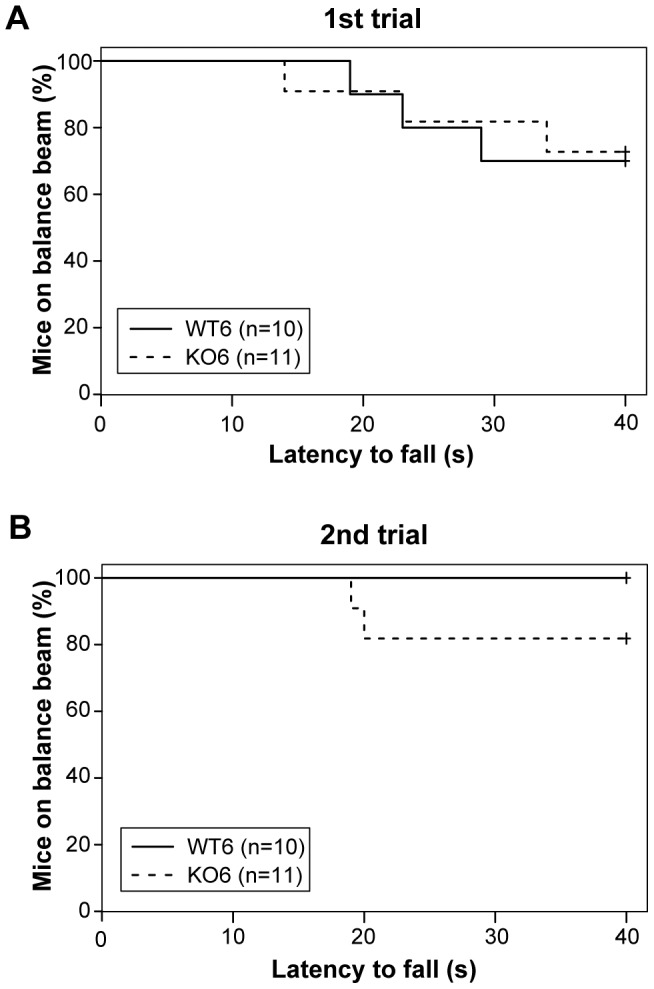
Kaplan-Meier curves that show latency to fall in balance beam test at first (A) and second (B) trial in WT (plain line) and D2KO mice (dotted line). No significant differences were detected in the log-rank test at both trials. However, none of WT mice but some D2KO fall during the second trial.