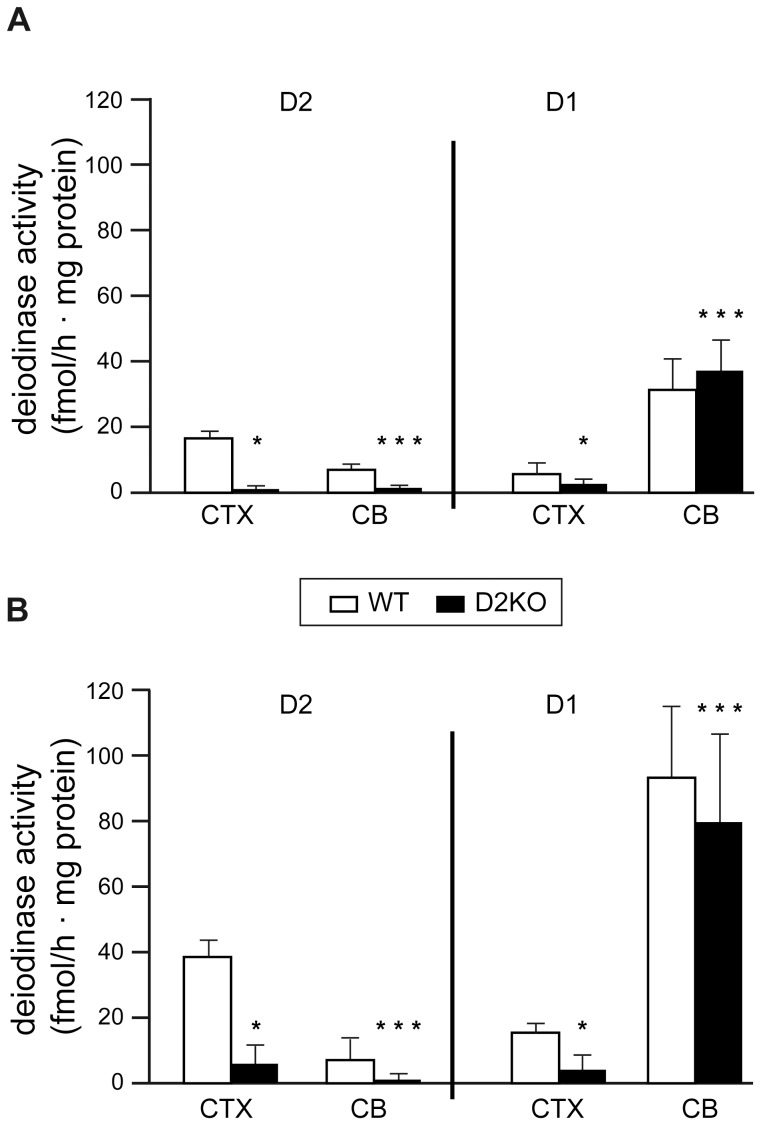
Figure 7. Differences in the activities of deoidinases.
Barplots represent D2 and D1 activities in cerebral cortex (CTX) and cerebellum (CB) of 3-months-old (A) and 6-months-old (B) WT and D2KO mice. Although statistical significant difference exists in D1 activity in the cortex between WT and D2KO at 6 months, this difference is not considered as relevant because D1 activity is very low in both conditions. Tissues from 5 to 6 animals of each condition were used for these assays. ***P-value less than 0.001; **P-value less than 0.01.

