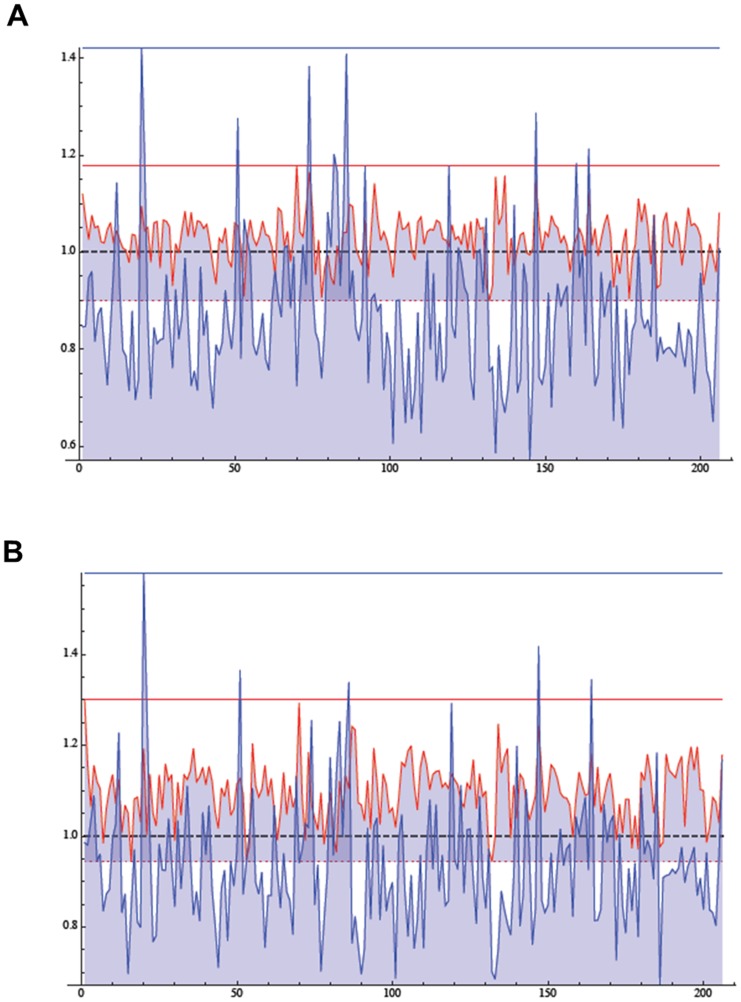
Figure 6. Commonly expressed genes in blood and airway neutrophils in comparison with control blood neutrophils.
A) List-plot graph representing the average expression of 206 genes in blood (red line) and airway (blue line) neutrophils in patients pre-therapy. The average expression of control neutrophils is put equal to 1. Blood neutrophils ratios range from 0.899 to 1.179, while airway neutrophils ratios range from 0.571 to 1.422. B) List-plot graph representing the average expression of 206 genes in blood (red line) and airway (blue line) neutrophils in patients post-therapy. The average expression of control neutrophils is put equal to 1. Blood neutrophils ratios range from 0.944 to 1.299, while airway neutrophils ratios range from 0.673 to 1.579.

