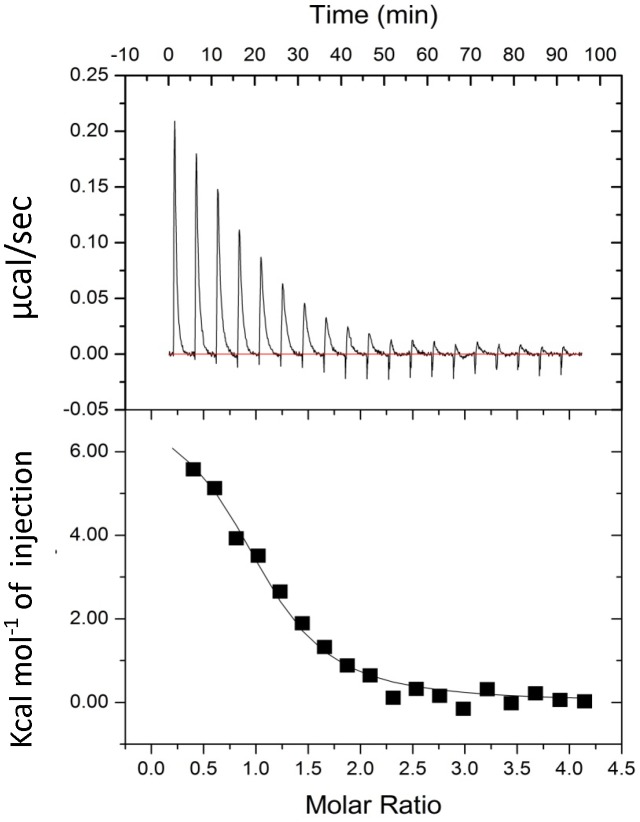
Figure 1. ITC titrations of the RAGE V domain with S100P.
The raw thermogram and binding isotherm of S100P binding to the RAGE V domain at 25°C. The upper panel represents the raw data and whereas the bottom panel is the integrated plot of the amount of heat liberated per injection as a function of the molar ratio of the WS100P to RAGE V Domain. The concentrations of the RAGE V domain and S100P used in the ITC experiments were 0.06 mM and 2.0 mM, respectively. The changes in the heat during each injection of S100P into a solution of the RAGE V domain fit a single-site binding model with a Kd of approximately 6 µM. The titrations were performed in 20 mM Tris-HCl (pH 7.0) containing 4 mM CaCl2.

