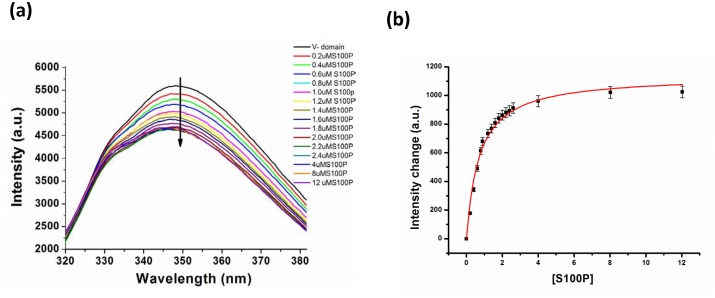
Figure 2. Interactions of the RAGE V domain with S100P monitored using fluorescence spectroscopy.
(a) Fluorescence emission spectra of the RAGE V domain illustrating the changes in the intrinsic tryptophan fluorescence with an increasing concentration of S100P in micromolar range. (b) Changes in the fluorescence intensities measured at 348.5 nm as a function of the S100P concentration was calculated according to Eq. 1. The binding was fit (solid red line) to a one-site binding model.

