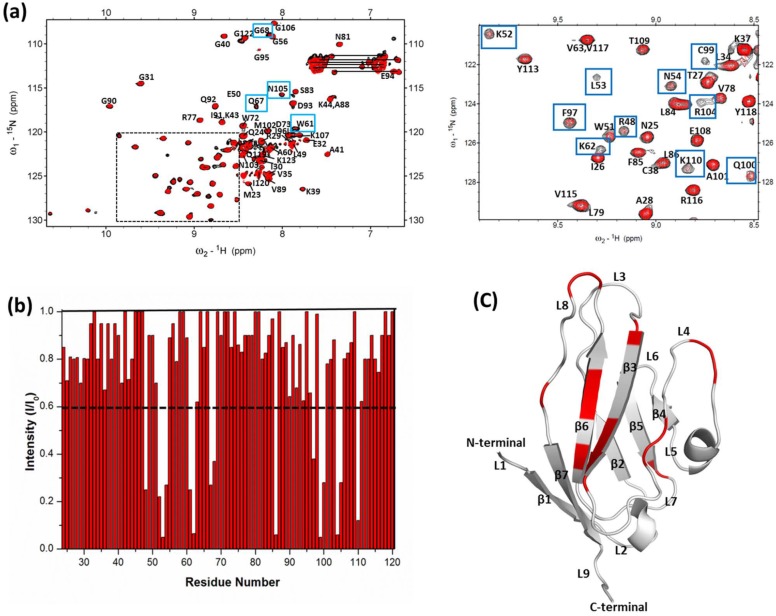
Figure 4. Analysis of the 1H-15N HSQC spectra of the RAGE V domain in complex with S100P.
(a) Overlaid 1H-15N HSQC spectra of 0.3 mM free 15N-labeled RAGE V domain (black) and the RAGE V domain in complex with 0.3 mM unlabeled S100P domain (red). Spectral changes are indicated by blue boxes. The dashed line indicates the expansion spectra shown on the right. (b) Bar graph of the cross-peak intensity (I/Io), where (I) is the cross-peak intensity of the RAGE V domain in complex with S100P and (Io) is the initial intensity of the free RAGE V domain, versus the RAGE V domain residue number (residues 21-121). The residues are numbered as previously reported [44]. The black dashed line is the threshold of the selected residues that exhibited a significant decrease in intensity (<0.6). (c) Ribbon representation of the RAGE V domain, with the residues that exhibited a decrease in the cross-peak intensity was mapped (red color) in the ribbon diagram. β-strands and loops are labeled in black.

