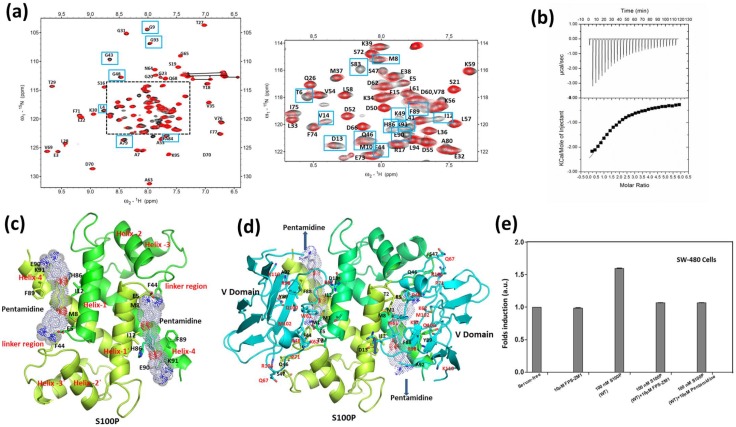
Figure 9. S100P-pentamidine interactions.
(a) Overlaid 1H-15N HSQC spectra of uniformly 15N-labeled free S100P (black) and S100P upon binding pentamidine at a 1∶1 molar ratio (red). (b) Thermodynamic studies of S100P with pentamidine as a ligand. Raw data (upper panels) and integrated heat measurements (lower panels) as a function of the molar ratio of the pentamidine to S100P protein. The dissociation constant (Kd) for this interaction is 305 µM at a 1∶1 stoichiometry. (c) Ribbon representation of the HADDOCK-modeled S100P-pentamidine complex. Monomers of the S100P homodimer are colored green and lemon green, with pentamidine shown as gray sticks. Structural elements of S100P are labeled in red. (d) Ribbon representation of the S100P-RAGE V domain complex with pentamidine at the binding interface. (e) Effects of pentamidine on S100P-mediated cell proliferation and RAGE signaling. SW-480 cells were treated with 10 µM FPS-ZM1, 100 µM S100P, 10 µM FPS-ZM1 plus 100 µM S100P or 10 µM pentamidine plus 100 µM S100P. Cell proliferation was analyzed after 48 h.

