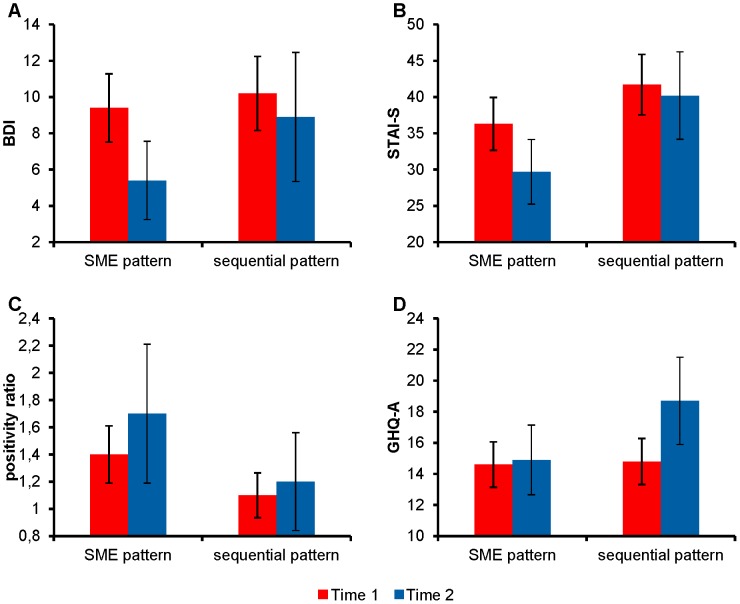
Figure 1. Means of resilience measures for the patterns of mixed emotions at two time points.
Display of mean values of depressive symptoms (BDI) (A), anxiety symptoms (STAI-S) (B), positivity ratio (C), and somatic symptoms (GHQ-A) (D) for the proneness to experiencing the pattern of secondary mixed emotion (SME pattern) and the proneness to experience the sequential pattern of mixed emotions (sequential pattern) at two time points - in the second month of the academic year and six months later. Bars are standard deviations.

