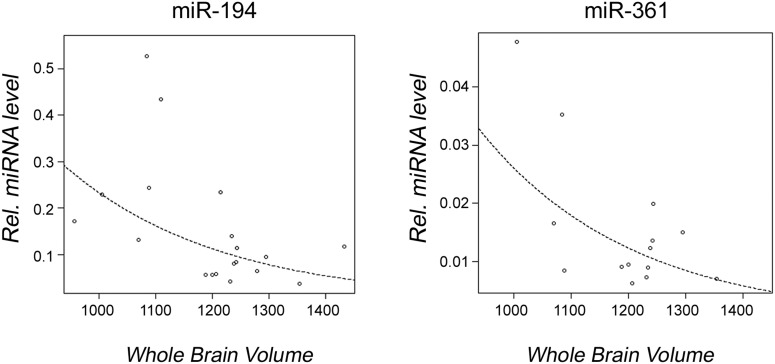
Figure 7. Observed correlation between dysregulated miRNAs and whole brain volume.
Graphs showing a significant correlation between miRNA expression levels and whole brain volume within the individuals with 22q11DS are shown. Open circles represent individuals with 22q11DS; the line represents line of best fit. P-values given are for each miRNA.

