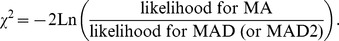
Table 4. Holstein and Jersey likelihood statistics (−2 log likelihood, P-value of χ 2 testb using likelihood ratio) for milk, fat, and protein yields, productive life (PL), daughter pregnancy rate (DPR), somatic cell score (SCS), fat percent (fat%) and protein percent (protein%) using three different models.
| Breed | Likelihood statistic | Modela | Milk | Fat | Protein | PL | DPR | SCS | fat% | protein% |
| HO | -2Log | MA | 523,875 | 326,549 | 306,908 | 106,438 | 158,369 | 52,811 | -76,286 | -130,192 |
| MAD | 523,689 | 326,407 | 306,728 | 106,438 | 158,370 | 52,807 | -76,294 | -130,204 | ||
| MAD2 | 523,687 | 326,416 | 306,723 | 106,437 | 158,370 | 52,805 | -76,292 | -130,202 | ||
| P-value | MA, MAD | 1.19E-42 | 4.86E-33 | 2.42E-41 | 1 | 1 | 0.023 | 0.0047 | 0.0005 | |
| MA, MAD2 | 4.34E-43 | 4.52E-31 | 1.96E-42 | 0.159 | 1 | 0.007 | 0.0143 | 0.0016 | ||
| JE | -2Log | MA | 141,040 | 89,552 | 84,317 | 39,698 | 49,014 | 13,892 | -15,500 | -29,456 |
| MAD | 141,005 | 89,519 | 84,284 | 39,694 | 49,013 | 13,891 | -15,502 | -29,464 | ||
| MAD2 | 140,998 | 89,514 | 84,276 | 39,695 | 49,014 | 13,891 | -15,502 | -29,464 | ||
| P-value | MA, MAD | 1.65E-09 | 4.61E-09 | 4.61E-09 | 0.023 | 0.159 | 0.159 | 0.1573 | 0.0047 | |
| MA, MAD2 | 4.56E-11 | 3.54E-10 | 7.61E-11 | 0.042 | 1 | 0.159 | 0.1573 | 0.0047 |
a
MA = only additive effects included; MAD = additive and dominance (values) effects included; and MAD2 = additive and dominance (deviations) effects included.
b