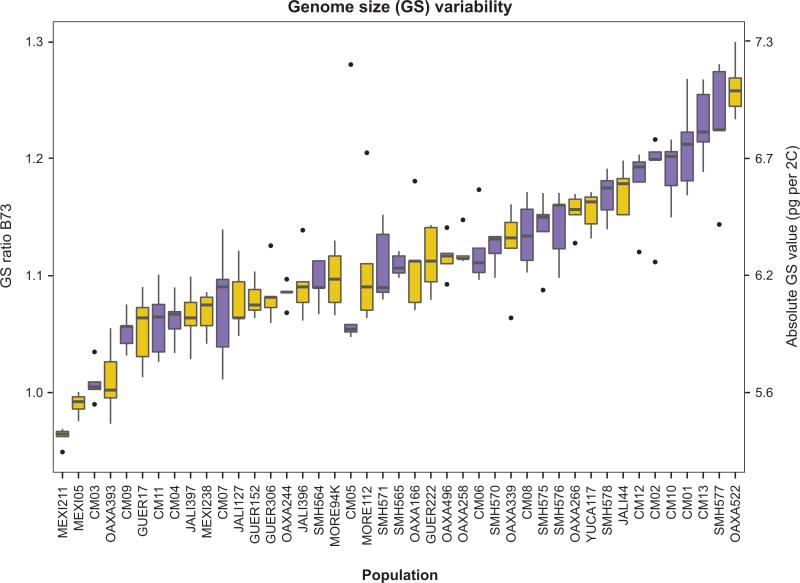
Fig. 2.
Genome size (GS) estimates for each maize landrace and each teosinte population sample measured either as a ratio over the B73 maize reference genome or in picograms per 2C nucleus (pg/2C). Populations are arranged by mean GS values. Cultivated, yellow boxes; wild, blue boxes. The boxes indicate the first quartile (leftmost line), the median (central line) and the third quartile (rightmost line). The whiskers represent the standard deviation, with the outliers represented by dots.

