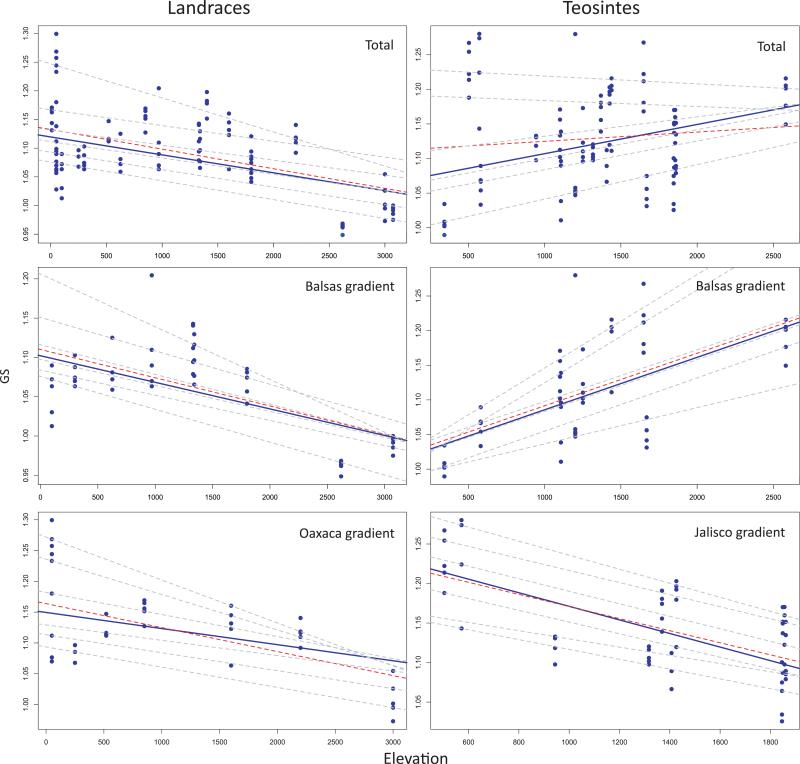
Fig. 3.
Scatter plot and quantile regression showing the relationship between genome size (GS) and elevation for the cultivated maize landraces and wild teosinte groups of samples. The dashed gray lines correspond to the quantiles (0.15, 0.30, 0.45, 0.60, 0.75, 0.90), the median fit is in solid blue and the least-squares estimate of the conditional mean function is the dashed (red) line.

