Figure 2.
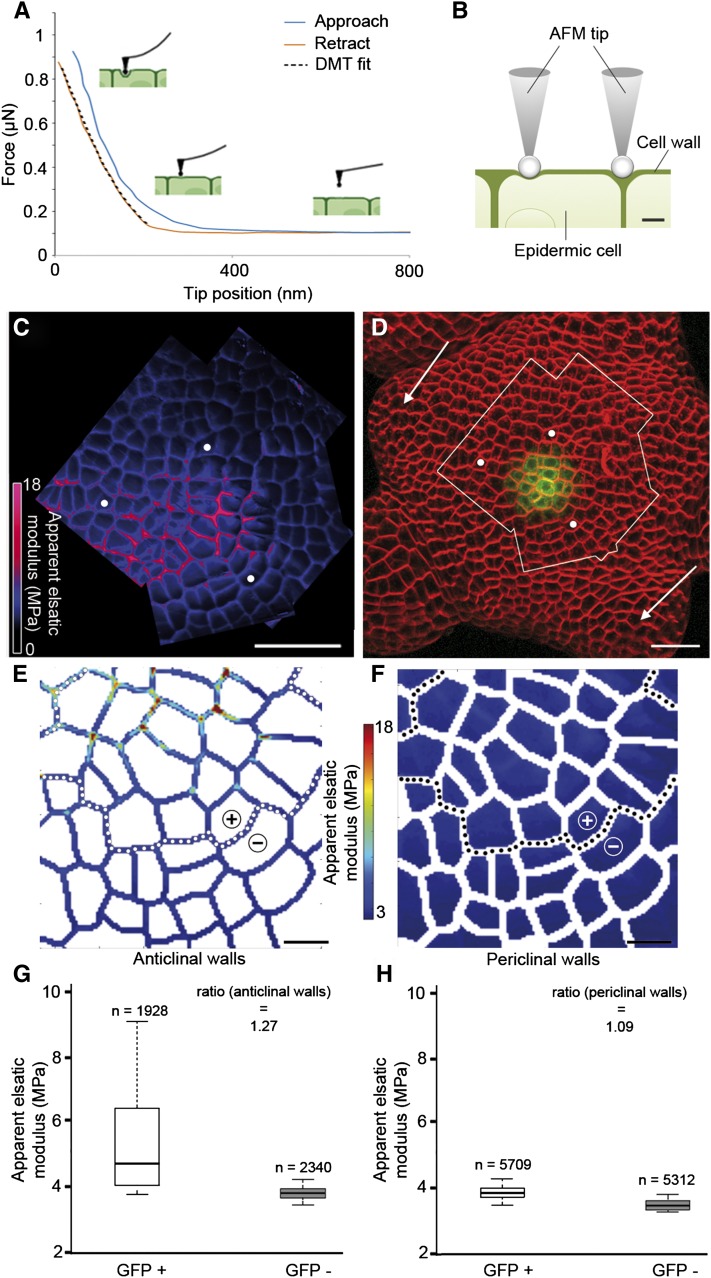
Mechanical measurements and cellular quantification of stiffness. A, Typical force-tip position approach (blue) and retraction (red) curves obtained on a SAM with a spherical probe tip. The retraction curve (red) is fitted using the DMT model (black dotted line) to obtain the value of the Ea. B, Diagrammatic representation of the AFM tip indenting an epidermal cell in the SAM, either on an outer (periclinal) wall or on walls normal to the surface (anticlinal). When indentation depth is greater than wall thickness, periclinal walls are expected to bend more and to appear softer than anticlinal walls. C and D, Analysis of stiffness in the SAM from a pCLV3::GFPer plant. Shown is the global map of the Ea of a region of the SAM (C), delimited by the white outline in the surface projection of the confocal image (D), with the white dots serving as reference landmarks and the arrows indicating stage 1 and 2 primordia. The plant was stained with the FM4-64 dye to detect cell contours (in red), while GFP expression is shown in green. E and F, Quantification of stiffness maps. Maps of anticlinal (E) and periclinal (F) walls were reconstituted after segmentation of one of the AFM stiffness maps from the global map shown in C (Supplemental Fig. S2). The dotted lines separate the GFP+ (CLV3-expressing zone) and GFP− regions, which are indicated with + and −. G and H, Box plots for anticlinal (G) and periclinal (H) walls obtained by analysis of the stiffness maps in E and F, respectively. The boxes extend from the first quartile to the third quartile and the whiskers from 10% to 90% of all the data set. Pixels were separated into two groups, GFP+ and GFP−. The number of pixels analyzed in each group is indicated. The ratio of median Ea values of GFP+ and GFP− is shown. Bars = 20 µm in C and D and 5 µm in E and F.

