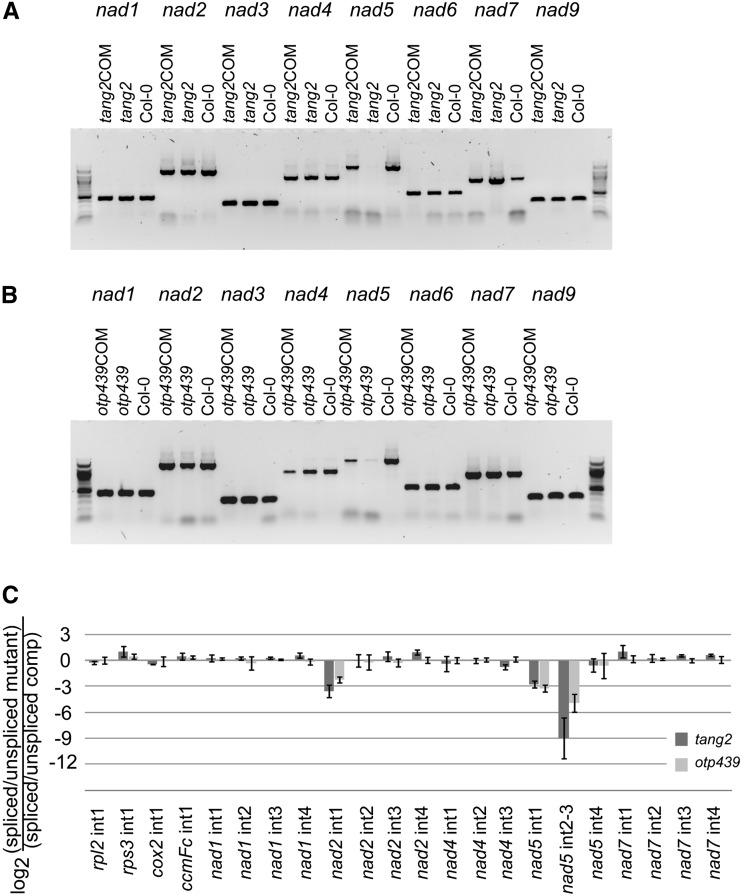
Figure 3.
A and B, Transcript analysis. RT-PCR is shown for nad1, nad2, nad3, nad4, nad5, nad6, nad7, and nad9 transcripts in tang2, tang2COM, and Col-0 plants (A) and in otp439, otp439COM, and Col-0 plants (B). C, Quantitative RT-PCR of intron-containing mitochondrial transcripts. The histogram shows the log2 ratio of spliced to unspliced forms for each transcript in the mutants as compared with the corresponding complemented plants. Each value is a mean of three biological replicates.

