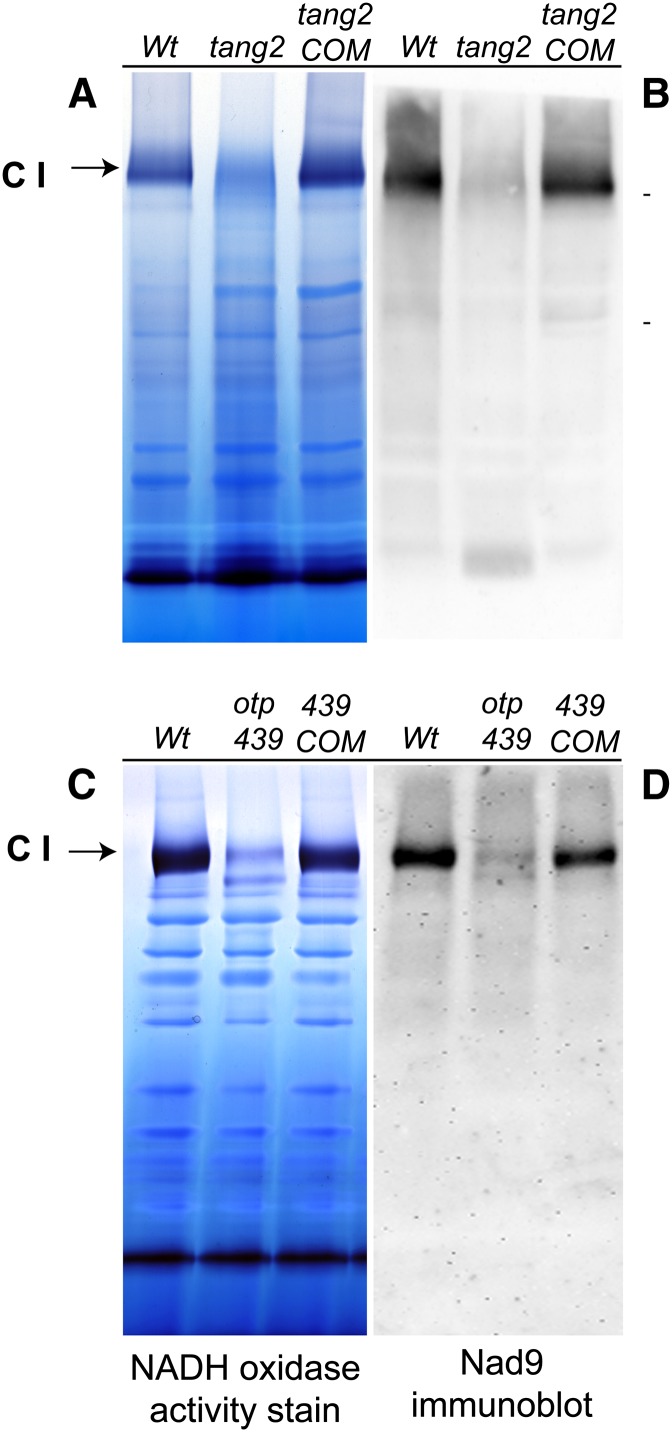
Figure 5.
BN-PAGE and immunoblot analysis of mitochondrial proteins from tang2 (A and B) and otp439 (C and D) mutants. A and C represent BN gels stained for the NADH oxidase activity, and B and D show the polyvinylidene difluoride membranes probed with an anti-Nad9 antibody. Complex I (CI) is indicated by the arrows. Wt, Wild type.

