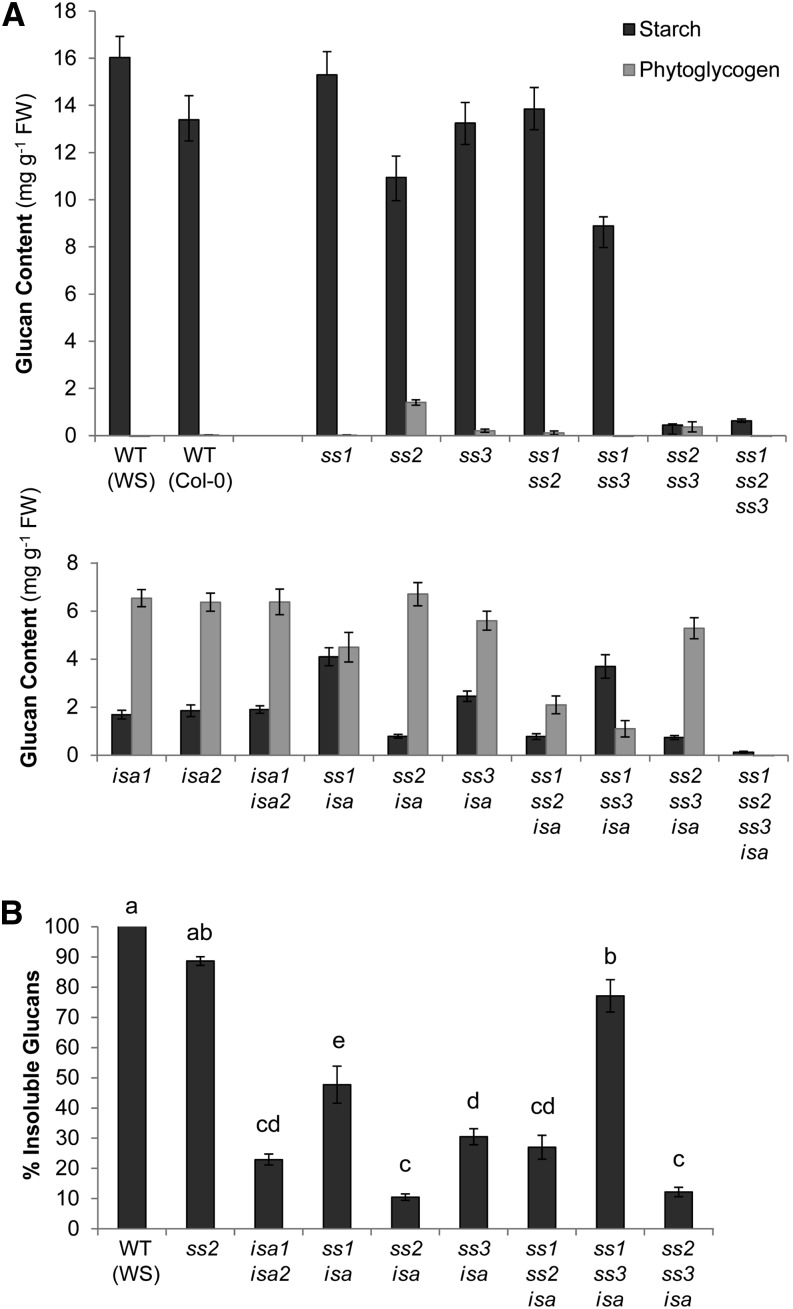
Figure 2.
Starch and soluble glucan content from ssisa mutants at the end of the day. Whole rosettes from plants were harvested at the end of the day and immediately frozen in liquid nitrogen. Starch and soluble glucans (phytoglycogen) were extracted using perchloric acid, and glucans were quantified after enzymatic digestion to Glc. Each value is the mean ± se (n = 6, except n = 10 for ss1ss2ss3 and ss1ss2ss3isa). A, Starch (black bars) and phytoglycogen (gray bars) content from the wild types and ss, isa, and ssisa mutant lines. B, Insoluble glucans given as a percentage of the total glucan measured in selected lines. Different letters correspond to values that are statistically different (tested with one-way ANOVA [Tukey test], P ≤ 0.01). WT, Wild type.

