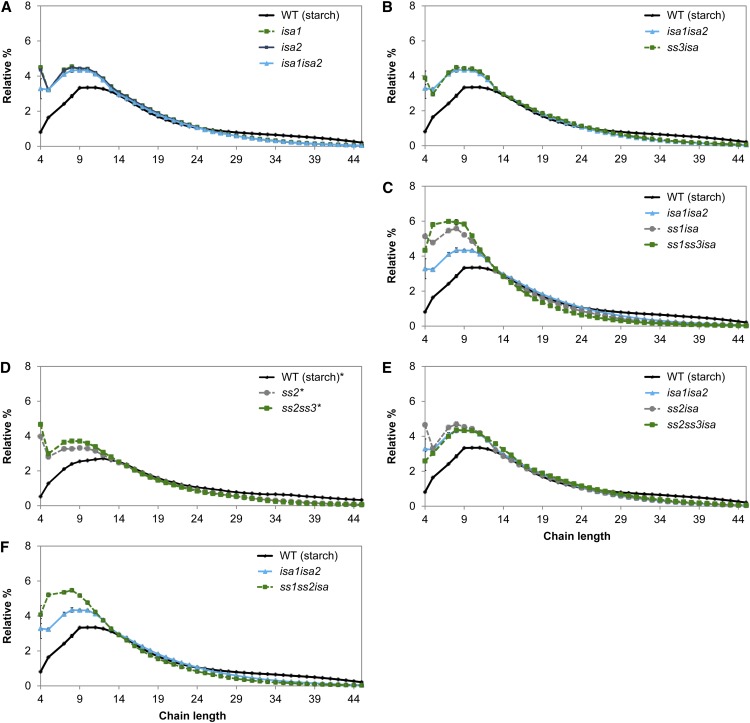
Figure 6.
β-Limit CLD of phytoglycogen. A to F, The β-CLDs of soluble glucans were obtained as described in Figure 5. Values are means ± se (n = 4, except n = 3 for ss1isa and ss1ss3isa and n = 5 for ss2 and ss2ss3). For ease of comparison, the β-CLDs from isa1isa2 phytoglycogen and/or wild-type starch (WS) are shown in each graph. The data for ss2 and ss2ss3 (marked by asterisks) were obtained from a separately grown batch of plants and the β-CLD from the corresponding wild-type starch is included. WT, Wild type.

