Figure 1.
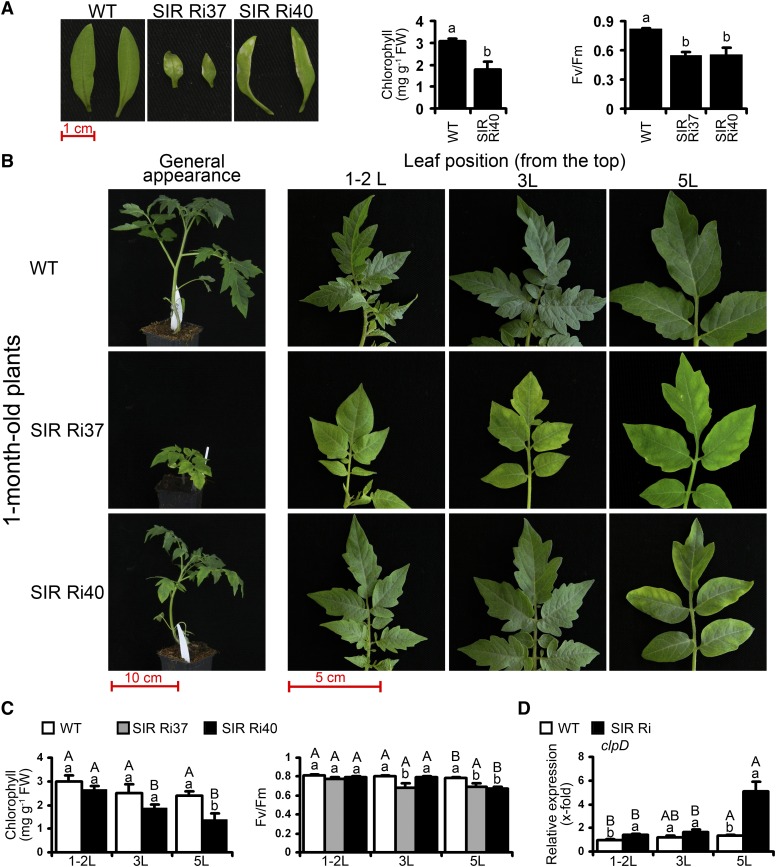
Early leaf senescence in SiR-impaired tomato plants compared with the wild type (WT). A, The damage on cotyledons of SIR Ri plants at the age of 2 weeks (left). Chlorophyll content and Fv/Fm in the cotyledons of SIR Ri lines are shown in the middle and right, respectively. The bars represent the average ± se (n = 6 in the chlorophyll assay; n = 8 for the wild type and SIR Ri37; and n = 5 for SIR Ri40 in the Fv/Fm assay). B, Leaf phenotypes of wild-type and SIR Ri plants at the age of 1 month. The top (1-2L), the third (3L), and the fifth (5L) leaves counted from the tops are shown together with the general plant appearance. C, Chlorophyll content (left) and maximal quantum yield (middle) in the 1-month-old tomato plants. Bars represent the average values ± se (n = 5 in the chlorophyll assay; n = 4 for the wild type; n = 6 for Ri37; and n = 4 for SIR Ri40 in the Fv/Fm assay). D, Expression of clpD transcript in the 1-month-old tomato plants. The values are average ± se (n = 8 for the wild type and SIR Ri [average of SIR Ri37 and SIR Ri40 plants]). Transcript quantification was performed by real-time PCR using TFIID (SGN-U571616) as a housekeeping gene. The values were normalized to the top leaf of the wild type. The values denoted with different letters are significantly different according to the Tukey-Kramer honestly significant difference mean-separation test (JMP 8.0; P < 0.05). The uppercase letters reflect differences between leaves of the same genotype; the lowercase letters distinguish different genotypes. The scale bars are shown.

