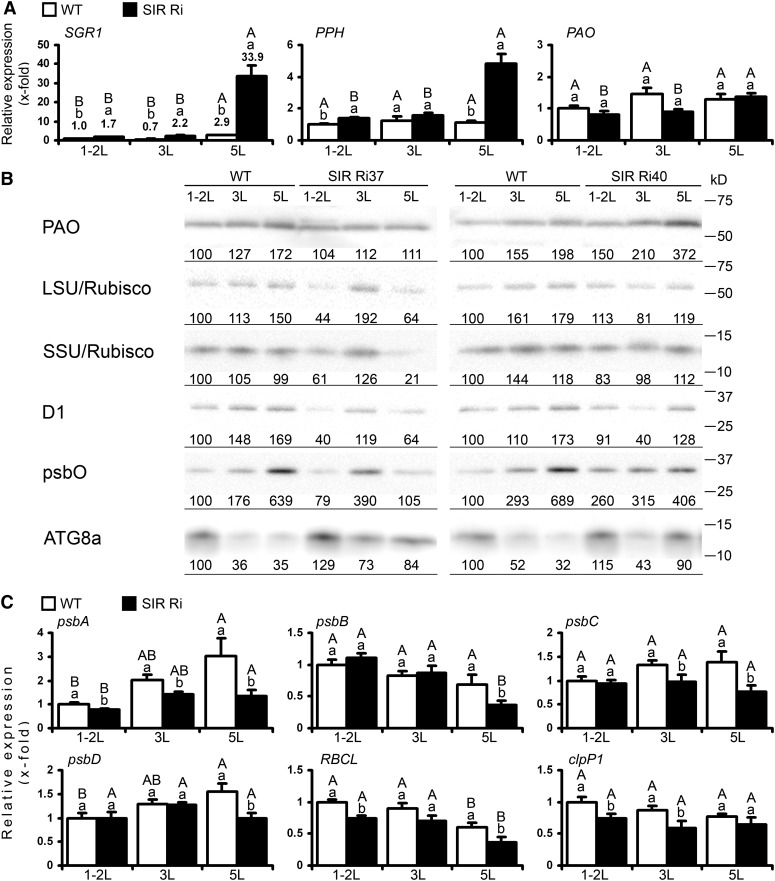
Figure 2.
The expression of plastidic transcripts and proteins in wild-type (WT) and SIR Ri plants at the age of 1 month. A, Expression of genes related to chlorophyll degradation in SIR Ri plants. The top (1-2L), the third (3L), and the fifth (5L) leaves (counted from the tops) were collected and analyzed by quantitative real-time PCR using TFIID (SGN-U571616) as a housekeeping gene. The values are average ± se (n = 8 for the wild type and SIR Ri [presented as average ± se of SIR Ri37 and SIR Ri40]). The values were normalized to the top leaf of the wild type. B, Immunoblotting analysis of wild-type and SIR Ri tomato plants. Leaf samples were collected according to their positions from the plant tops. Extracted proteins were separated using SDS-PAGE, transferred to polyvinylidene difluoride membranes, and incubated with protein-specific antibodies as described in “Materials and Methods.” Protein extracts were loaded as 0.5 µg per lane for D1, psbO (one of the subunits that construct the water-splitting system of PSII), and Rubisco (LSU and SSU) or 10 µg per lane for PAO and ATG8a. Relative band intensities are shown normalized to the top leaves of the wild-type plants. The positions of Precision Plus Protein Standards (Bio-Rad) are shown. C, Expression of genes encoded by chloroplast genome. Quantitative real-time PCR analysis was performed as described in A. The values denoted by different letters are significantly different according to the Tukey-Kramer honestly significant difference mean-separation test (JMP 8.0; P < 0.05). The uppercase letters reflect differences between leaves of the same genotype; the lowercase letters distinguish different genotypes.

