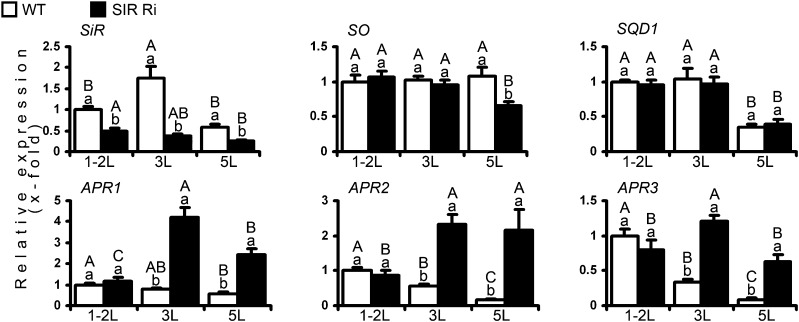
Figure 4.
The impact of SiR suppression on transcripts of the sulfite network genes. The top (1-2L), the third (3L), and the fifth (5L) leaves (counted from the tops) were collected from 1-month-old SIR Ri and wild-type (WT) plants and analyzed by quantitative real-time PCR using TFIID (SGN-U571616) as a housekeeping gene. The values are average ± se (n = 8 for the wild type and SIR Ri [SIR Ri37 and SIR Ri40 plants were summarized together]). The values were normalized to the top leaves of the wild-type plants. The values denoted by different letters are significantly different according to the Tukey-Kramer honestly significant difference mean-separation test (JMP 8.0; P < 0.05). The uppercase letters reflect differences between leaves of the same genotype; the lowercase letters distinguish different genotypes.

