The reversible collapse of leaf transfusion tracheids of Taxus baccata under desiccation is related to reversible declines in leaf hydraulic conductance, suggesting a circuit breaker-like function that protects the xylem from excessive tensions.
Abstract
Declines in leaf hydraulic conductance (Kleaf) with increasing water stress have been attributed to cavitation of the leaf xylem. However, in the leaves of conifers, the reversible collapse of transfusion tracheids may provide an alternative explanation. Using Taxus baccata, a conifer species without resin, we developed a modified rehydration technique that allows the separation of declines in Kleaf into two components: one reversible and one irreversible upon relaxation of water potential to −1 MPa. We surveyed leaves at a range of water potentials for evidence of cavitation using cryo-scanning electron microscopy and quantified dehydration-induced structural changes in transfusion tracheids by cryo-fluorescence microscopy. Irreversible declines in Kleaf did not occur until leaf water potentials were more negative than −3 MPa. Declines in Kleaf between −2 and −3 MPa were reversible and accompanied by the collapse of transfusion tracheids, as evidenced by cryo-fluorescence microscopy. Based on cryo-scanning electron microscopy, cavitation of either transfusion or xylem tracheids did not contribute to declines in Kleaf in the reversible range. Moreover, the deformation of transfusion tracheids was quickly reversible, thus acting as a circuit breaker regulating the flux of water through the leaf vasculature. As transfusion tissue is present in all gymnosperms, the reversible collapse of transfusion tracheids may be a general mechanism in this group for the protection of leaf xylem from excessive loads generated in the living leaf tissue.
Declines in leaf hydraulic conductance (Kleaf) as water potentials become more negative occur in all plants studied so far (Brodribb and Holbrook, 2003; Sack and Holbrook, 2006; Johnson et al., 2011). Generally, declines in Kleaf precede any decrease in stem hydraulic conductivity for angiosperms (Hao et al., 2008; Chen et al., 2009; Zhang et al., 2009; Johnson et al., 2011; Yang et al., 2012) and gymnosperms (Johnson et al., 2011; McCulloh et al., 2014), suggesting that the leaf is a more sensitive part of the water transport pathway than the stem. Measurement of the effects of decreasing water potential on Kleaf for some conifer species suggests that Kleaf is severely impaired or even totally lost during the day, when transpiration is still considerably high (Domec et al., 2009; Johnson et al., 2009a, 2011). This pattern results in a paradox that conifer leaves appear capable of maintaining high transpiration rates despite substantially impaired leaf water transport. In addition, the apparent recovery of Kleaf from daily minimums as water potentials relax diurnally has been interpreted as evidence of novel refilling (dissolution of embolisms while the xylem is under tension) in conifers (Johnson et al., 2009b).
In these studies, Kleaf was measured using the rehydration technique (Brodribb and Holbrook, 2003), which measures the hydraulic conductance of the whole leaf, including the xylem conduits and nonvascular components; therefore, the limiting resistance may reside in the axillary vasculature (xylem tracheids), the living tissue outside the vascular bundle, or the radial transfusion tracheids in the vascular bundle that mediate between the two. Acoustic emission and cryo-scanning electron microscopy (CSEM) have been used to implicate cavitation in the dehydration-induced declines in Kleaf observed in angiosperms and conifers (Johnson et al., 2009a, 2012a). Alternatively, dehydration-induced declines in Kleaf at water potentials insufficient to induce cavitation may be related to changes in living cells in tissues outside the xylem (Scoffoni et al., 2014). Dehydration-induced declines in Kleaf have also been attributed to the deformation of xylem tracheids in pine needles (Pinus cembra, P. mugo, P. nigra, and P. sylvestris; Cochard et al., 2004). That axial xylem tracheids may deform at sufficiently large tensions has been known for some time (Kuo and Arganbright, 1978), yet the significance of this phenomenon for leaf water transport remains unclear. In stems, cavitation appears to occur at less negative water potentials than those predicted to cause implosion of the conduit (Hacke et al., 2004). Elastic collapse, or deformation that reverses upon the alleviation of stress, has been shown to occur in accessory (outside the vascular bundle) transfusion tracheids in Podocarpus grayae (Brodribb and Holbrook, 2005). Yet, the mechanical behavior under water stress of transfusion tracheids in leaf vascular bundles, and the resulting effects on Kleaf, remain unexplored.
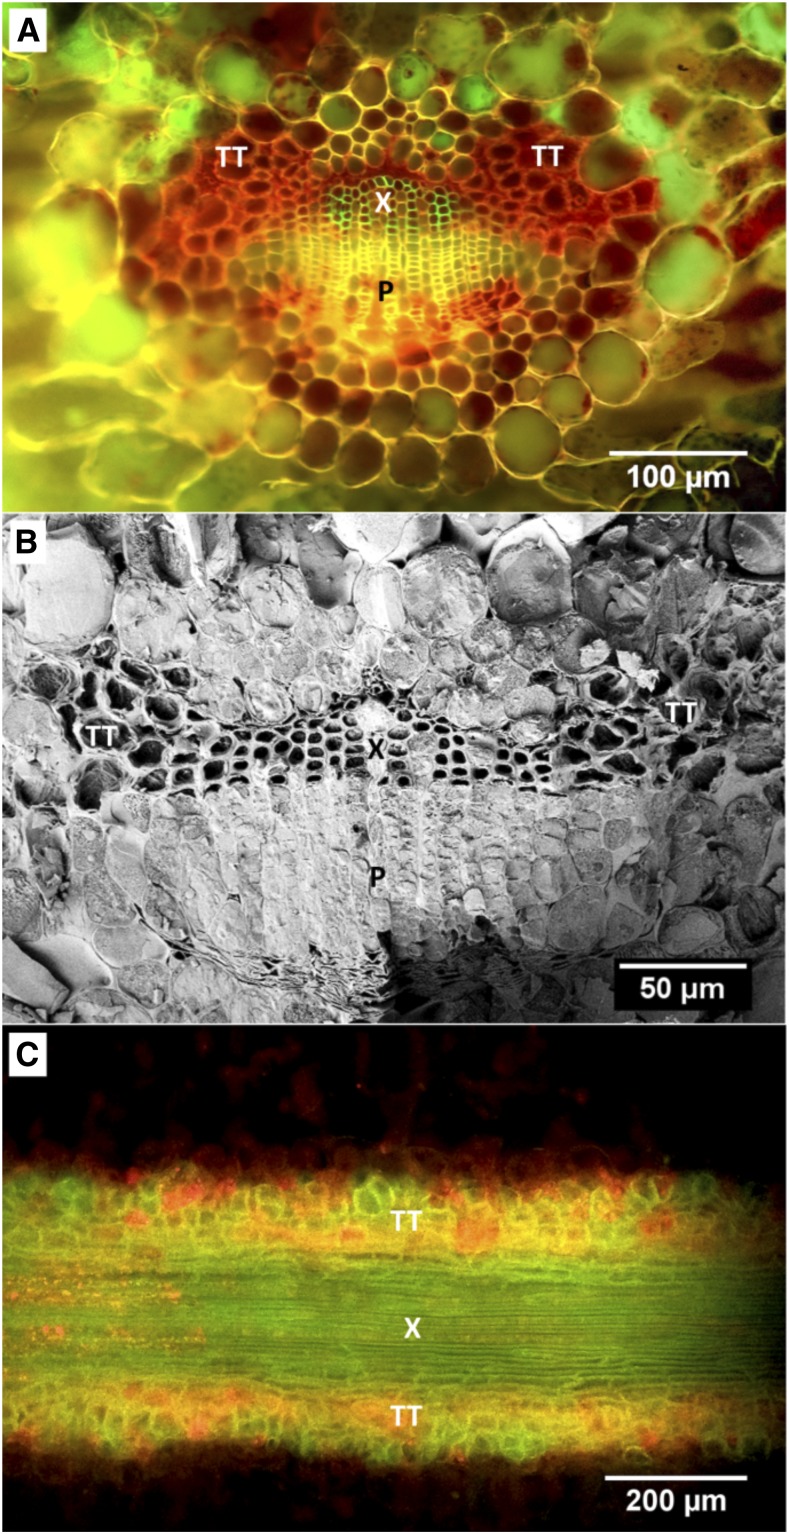
After its first discovery in Taxus baccata leaves in 1864, transfusion tissue has been found to be a universal tissue in gymnosperms (Frank, 1864; von Mohl, 1871; Hu and Yao, 1981). Transfusion tissue includes transfusion tracheids (Fig. 1), transporting water radially from the axial xylem to the bundle sheath, transfusion parenchyma, and albuminous cells (von Mohl, 1871; Hu and Yao, 1981), which are believed to provide a pathway for the diffusion of carbohydrates to the phloem (Worsdell, 1897; Esau, 1977). Transfusion tracheids are usually larger in size and less lignified than axial tracheids (Esau, 1977; Hu and Yao, 1981), and thus may be more prone to dehydration-induced deformation (as described by Timoschenko’s equation; Brodribb and Holbrook, 2005) and have been suggested to serve a water storage function (Takeda, 1913). However, their irregular geometry and diversity in shape (Hu and Yao, 1981) pose challenges to observing and quantifying deformation during desiccation. In some genera (Cycas, Podocarpus, and Dacrydium), additional transfusion tissue (termed accessory transfusion tissue) extends outward from the tissues of the vascular bundle into the photosynthetic mesophyll (Esau, 1977).
Figure 1.
Structure and position of transfusion tissue in relation to the axial vascular system in leaves of T. baccata. A, Cryo-fluorescence image of a cross section of a T. baccata leaf after infusion with acid fuchsin. Tissues are xylem (X), phloem (P), and transfusion tracheids (TT). B, CSEM image of a cross section of a hydrated T. baccata leaf. The sample was heavily etched to sublimate xylem and transfusion tracheid sap, which does not have high concentrations of solutes, to show the cell wall structure of xylem and transfusion tracheids. C, Fluorescence image of a paradermal section of the leaf midvein stained with phloroglucinol/HCl.
The objectives of this study were to separate the dehydration-induced declines in Kleaf into components that were reversible or irreversible by partial relaxation of water stress and to assess the contribution of elastic (reversible) deformation of transfusion tracheids versus cavitation to the decline in Kleaf. We chose to study T. baccata specifically because it does not produce resin (Hils, 1993). Although efforts have been made to minimize the effects of resin in Kleaf measurements (e.g. Charra-Vaskou et al., 2012), the blocking effects of resin on cut ends during the measurements are not completely avoidable and are difficult to quantify. We used rehydration kinetics (Brodribb and Holbrook, 2003) to quantify Kleaf with an additional protocol of partial stress relaxation (to approximately −1 MPa) followed by analysis of hydraulic conductance (in the partially relaxed state) by rehydration kinetics to separate reversible and irreversible effects of the initial stress. To observe dehydration-induced structural changes in transfusion tracheids, we used both CSEM and cryo-fluorescence microscopy (CFM), which have been employed previously to observe dehydration-induced deformation in xylem tracheids and accessory transfusion tracheids, respectively (Cochard et al., 2004; Brodribb and Holbrook, 2005).
RESULTS
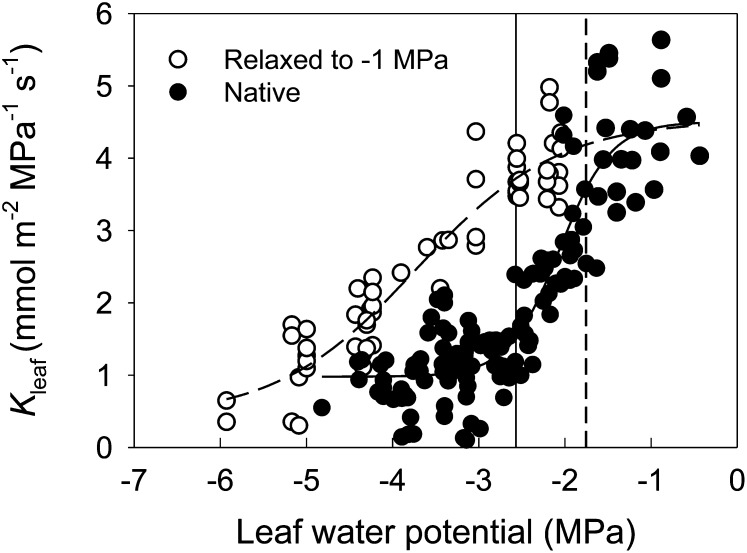
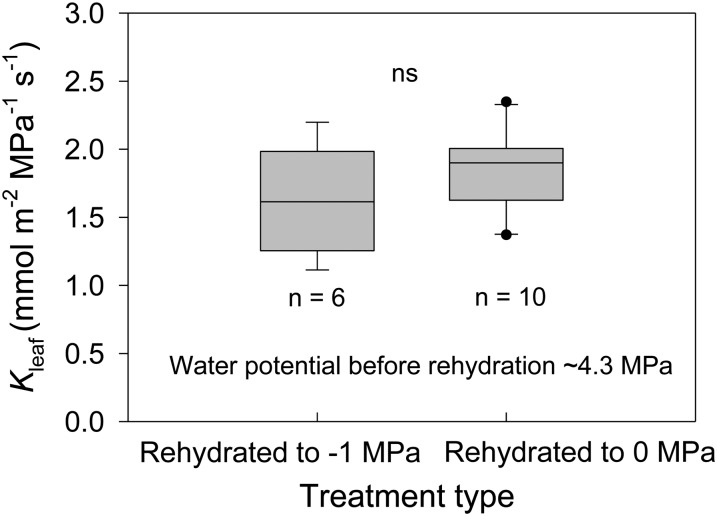
At low levels of water stress, the fitted maximum Kleaf of T. baccata was 4.3 mmol m−2 MPa−1 s−1 (Fig. 2). Leaf hydraulic conductance measured at the initial stress (conventional method) started to decrease at approximately −1.8 MPa, which is close to the midday leaf water potential, and approached the fitted minimum Kleaf of approximately 1.2 mmol m−2 MPa−1 s−1 at −2.6 MPa, approximately the bulk leaf turgor loss point (TLP). Yet, Kleaf measured after the samples were rehydrated and reequilibrated to −1 MPa started to decrease only at −2.6 MPa, approaching the minimum Kleaf at −5.2 MPa. In addition, the Kleaf decline between −2 and −3 MPa in T. baccata recovered to maximum values after a short time period (5–12 min) of rehydration to −1 MPa. Notably, rehydrating samples from water potentials of approximately 4.3 to 0 MPa and maintaining the samples at full hydration overnight did not increase Kleaf significantly compared with samples rehydrated to −1 MPa (Fig. 3), indicating no evidence for cavitation refilling by capillarity or any other mechanism during our experiments.
Figure 2.
Response of Kleaf to leaf water potential. Data were fitted with a sigmoid function (y = a + b/[1 + e−(x − c)/d]). Black circles are Kleaf measurements at water potentials reached by bench drying (conventional rehydration technique), and white circles are measurements after bench-dried samples were rehydrated to approximately −1 MPa. The solid vertical line indicates the leaf TLP, while the dashed line marks midday leaf water potential.
Figure 3.
Box plots of Kleaf for samples rehydrated to −1 MPa and those rehydrated to 0 MPa and kept fully rehydrated overnight. Water potentials of samples prior to rehydration were approximately −4.3 MPa. For both groups, Kleaf was measured at leaf water potentials of approximately −1 MPa. Boundaries of the boxes indicate the 25th and 75th percentiles, whiskers denote the 90th and 10th percentiles, points represent observations beyond these percentiles, and internal lines denote the medians. ns, No significant difference between the means of these two treatments (one-way ANOVA).
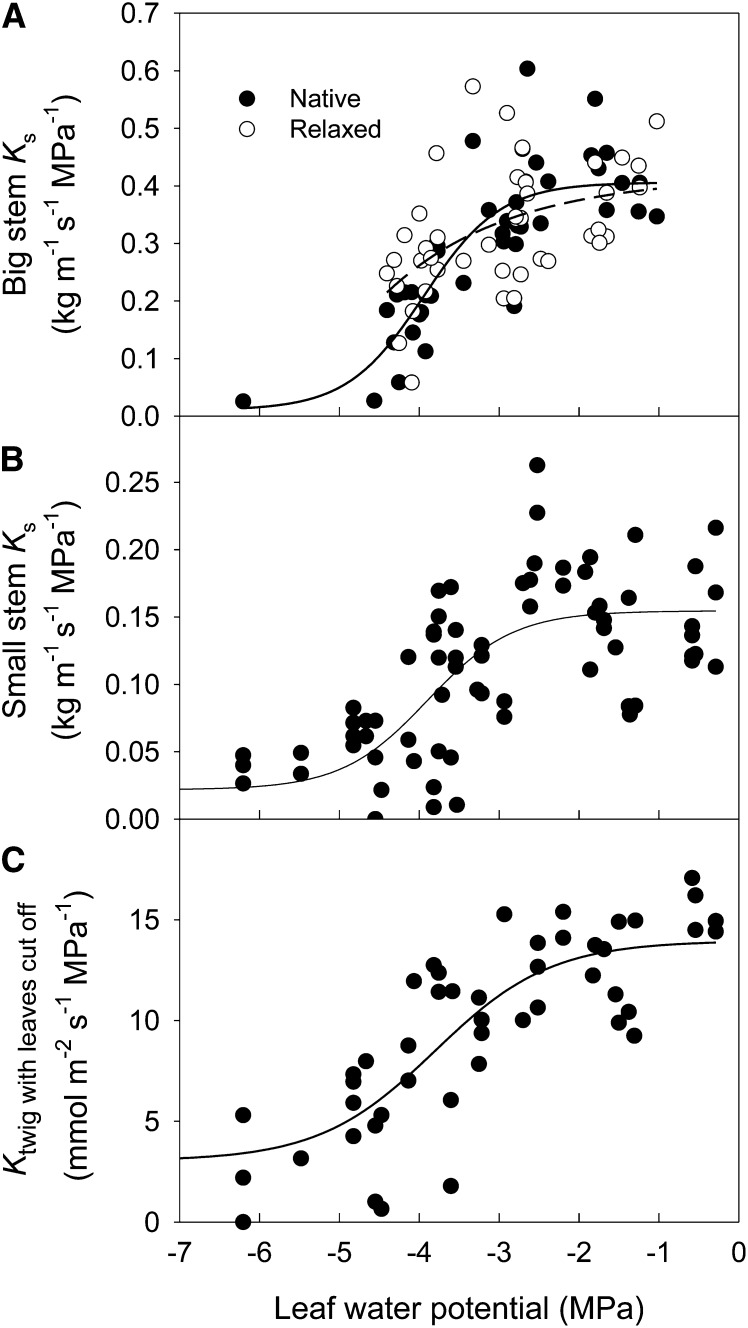
As we could only measure Kleaf for an aggregate of leaves hydrating in parallel from a common stem, we also studied the effects of xylem tensions on steady-state stem vulnerability. Steady-state stem vulnerability curves for which samples were excised at native versus relaxed tensions showed no significant difference, suggesting no effect of cutting under tension (Wheeler et al., 2013) in this species (Fig. 4A). We found stem vulnerability as determined here by benchtop dehydration to be broadly consistent with an earlier report based on the centrifuge method (Cochard et al., 2007). We also checked for an effect of stem size on vulnerability: regardless of the stem size, stem xylem area-specific hydraulic conductivity or stem hydraulic conductance started to decrease at water potentials of approximately −3.0 MPa, approaching their minimum values at around −4.5 MPa (Fig. 4). Therefore, we do not expect stem conductance to have been a limiting resistance in the generation of conventional Kleaf vulnerability curves. However, stem vulnerability was similar to the irreversible component of leaf vulnerability as measured with the modified technique, which relaxed the leaves to water potentials approximately −1 MPa prior to Kleaf measurement (Fig. 2).
Figure 4.
Responses of hydraulic conductivity of different size stems to water potential. A, Big stems with diameter of approximately 3.5 mm. B, Small stems with diameter of approximately 2 mm. C, Terminal twigs with needles removed. Black circles in A are the specific hydraulic conductivity values (Ks) of branches in which the measurement segments were excised at the water potentials reached by bench drying, and white circles are observations for which the bench-dried branches were rehydrated to approximately −0.3 MPa prior to excision of the measurement segments. Solid lines are sigmoid functions (y = a + b/[1 + e−(x − c)/d]) fitted to the data.
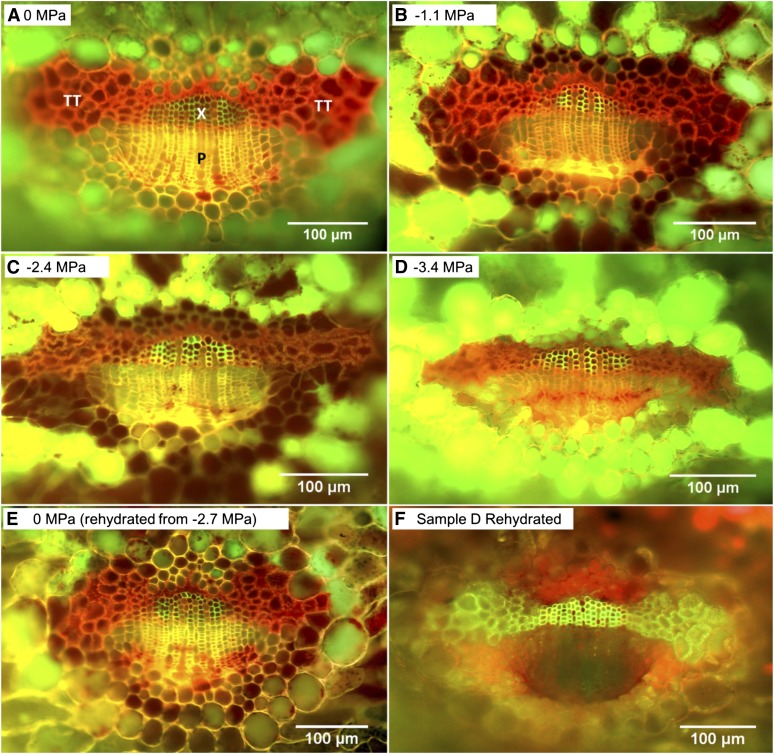
CFM images showed a gradual deformation of the transfusion tracheids as the leaf water potential decreased and a recovery to hydrated shapes when the samples were rehydrated (Fig. 5; n = 29). Partial deformation of transfusion tracheids was found by −2.4 MPa (Fig. 5C), and nearly complete collapse of transfusion tracheids was detected by −3.4 MPa (Fig. 5D). Previously dehydrated leaf samples rehydrated to 0 MPa showed no deformation in transfusion tracheids (Fig. 5E), demonstrating that the deformations were reversible. Furthermore, when CFM samples showing transfusion tracheids nearly completely collapsed were thawed and rehydrated, the transfusion tracheids recovered to a normal hydrated shape (Fig 5, D and F).
Figure 5.
Fluorescence images of T. baccata cross sections under different water potentials: 0 MPa (A), −1.1 MPa (B), −2.4 MPa (C), −3.4 MPa (D), 0 MPa (rehydrated from −2.7 MPa; E), and sample D rehydrated (F). A to E are cryo-fluorescence images after infusion with acid fuchsin, while F is a fluorescence image with sample D thawed, rehydrated, and stained with phloroglucinol/HCl. Tissues are xylem (X), phloem (P), and transfusion tracheids (TT).
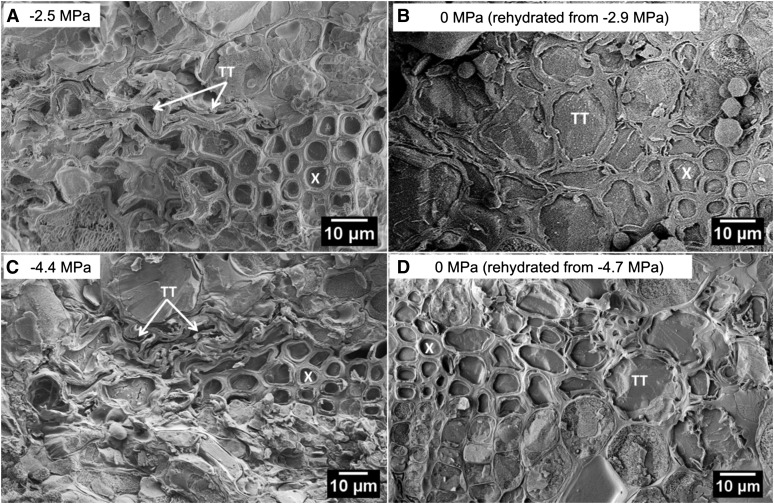
If embolism in xylem tracheids were responsible for the declines in Kleaf, we would expect that at −2.5 MPa, one-half or more of the xylem tracheids would be air filled. However, CSEM imaging of seven samples at approximately −2.5 MPa showed that almost all the xylem tracheids were filled with ice, consistent with an absence of cavitation and embolism formation resulting from this level of stress (Fig. 6A; representative image). Some samples did show evidence of a relatively small number (one to eight) of air-filled and deformed xylem tracheids at the most adaxial xylem position (as evident in Fig. 6C), independent of the applied level of stress. Such damage is consistent with classical descriptions of exarch protoxylem development and subsequent destruction (Esau, 1977), possibly exacerbated by winter freezing. Nevertheless, according to the leaf vulnerability curves, Kleaf measured at approximately this water potential (i.e. using the conventional rehydration technique) decreased significantly from the maximum, whereas Kleaf measured after relaxation to −1 MPa showed no significant decrease (Fig. 2). A few samples were also imaged with CSEM at higher levels of stress or following sample rehydration (Fig. 6, B–D; n = 2, 1, and 2, respectively) and were found to agree with the CFM results discussed above (Fig. 5).
Figure 6.
CSEM images of T. baccata leaf cross sections at −2.5 MPa (A) and −4.4 MPa (C) and at 0 MPa rehydrated from −2.9 MPa (B) and −4.7 MPa (D). Labeled tissues are xylem (X) and transfusion tracheids (TT).
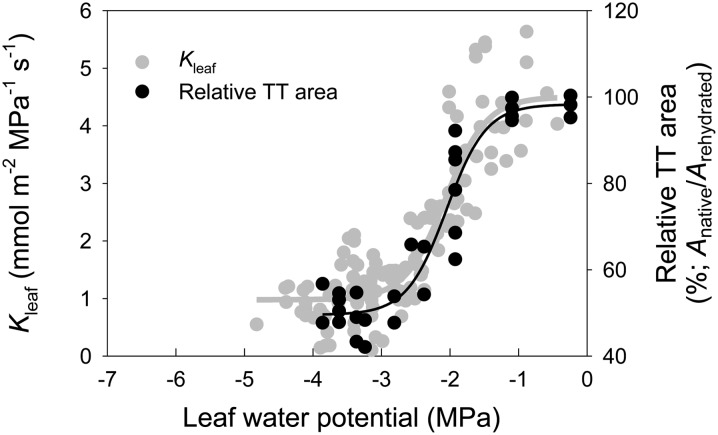
To quantify the degree of observed deformation at a particular level of stress, we measured the area of transfusion tracheids as a percentage of the maximum area of transfusion tracheids of the same sample after rehydration. The area of transfusion tracheids started to decrease at −1.9 MPa and approached minimum values at around −2.8 MPa (Fig. 7). In contrast, no deformation was found in the xylem tracheids as the leaf water potential decreased (Figs. 5 and 6). Finally, the vulnerability of transfusion tracheids to dehydration-induced deformation showed close convergence with the leaf vulnerability to loss of Kleaf detected with the conventional rehydration technique (Fig. 7).
Figure 7.
Response of the area of the transfusion tracheids (TT) to leaf water potential. Relative transfusion tracheid area was standardized as the percentage of the transfusion tracheid area for the same cross section when fully rehydrated. Background points are Kleaf measured at water potentials the sample achieved after bench drying (from Fig. 2). Solid lines are sigmoid functions (y = a + b/[1 + e−(x − c)/d]) fitted to the data.
DISCUSSION
We separated dehydration-induced declines in Kleaf for T. baccata into two components: one reversible by partial stress relaxation and one irreversible. We then showed that the reversible part was not related to xylem cavitation but in fact was closely associated with the deformation of transfusion tracheids. We believe that this rapid Kleaf recovery does not represent cavitation repair, because at water potentials of −2.5 MPa, CSEM showed that xylem tracheids were filled with water (Fig. 6A). In contrast, the vulnerability curve with samples relaxed to and measured at water potentials of approximately −1 MPa likely reflects the vulnerability of the leaf (and/or stem) axial xylem to cavitation, because the impact of other components of the leaf hydraulic system have been removed. Interestingly, the vulnerability curve so defined showed convergence with the stem vulnerability curves, suggesting no hydraulic segmentation between stem and leaves in terms of axial xylem vulnerability to cavitation. We expect that the reversible deformation of transfusion tracheids and its close association with the decline in Kleaf is not an isolated phenomenon particular to T. baccata, because dehydration-induced deformation of transfusion tracheids has been found in leaves of Pinus strobus and Pinus nigra as well (Parker, 1952), and transfusion tracheids of Pinus radiata also show elastic expansion and shrinkage during the freeze-thaw process (Roden et al., 2009).
The stems of conifer species generally have higher resistance to cavitation than those of the angiosperms and tend to operate farther away from the cavitation threshold during the day (Choat et al., 2012). On the other hand, conifer leaves have been reported to be quite vulnerable to declines in Kleaf (the water potential causes 50% loss of Kleaf, ranging from −0.8 to −1.65 MPa) and have been assumed to undergo diurnal cavitation and repair (Woodruff et al., 2007, 2008; Domec et al., 2009; Johnson et al., 2009a, 2009b, 2011; McCulloh et al., 2014; but see Brodribb and Cochard, 2009; McAdam and Brodribb, 2014). This pattern results in a puzzle that, if stem xylem of conifers is highly resistant to cavitation, what is the adaptive value of highly vulnerable leaves that require potentially metabolically expensive diurnal repair? Here, our results suggest that diurnal cavitation and repair in conifer leaves, as inferred from conventional rehydration techniques, may not be as common as is currently believed. Furthermore, in this non-resin-producing species, Kleaf does not decline until leaf water potentials are more negative than typical midday values. As a result, maximum transpiration rates in T. baccata occur when the leaves have their maximum hydraulic conductance.
By contrast, the collapse in transfusion tracheids is quickly reversible, potentially providing a low-cost circuit breaker, preventing xylem dysfunction before complete stomatal closure. Although more mechanistic studies are needed, stomata of conifer leaves are suggested to be less sensitive to air vapor pressure deficit than angiosperms (Johnson et al., 2012b). Shrinkage of the transfusion tissue must also result in water release, buffering the water potential of the xylem. The water storage in accessory transfusion tracheids of P. grayae was suggested to be enough to bring the leaf from −2 to 0 MPa and, therefore, could protect the xylem from increasing tensions by supplying transpirable water before complete stomatal closure (Brodribb and Holbrook, 2005). In T. baccata, transfusion tracheids constitute a smaller proportion of leaf tissue volume than the accessory transfusion tracheids in P. grayae, so their collapse would be expected to have less of a buffering effect. However, leaf hydraulic capacitances of conifer species are generally higher than those of angiosperm species (Brodribb et al., 2005), and water release from transfusion tissue has been suggested as a factor that may contribute to the high capacitance of conifers (Johnson et al., 2009a). Therefore, our results suggest that transfusion tracheids in T. baccata may function both as a circuit breaker as well as a capacitor (reservoir) for buffering the xylem during stomatal closure.
MATERIALS AND METHODS
Plant Materials
Measurements were performed on five Taxus baccata trees growing on the campus of Harvard University in Cambridge, Massachusetts. The trees were 8 to 10 m tall, and samples were collected with a pole pruner. All of the trees received supplemental irrigation during periods with low rainfall. This study was carried out from March 2012 to November 2013 on leaves formed in the previous year (1 year old).
Xylem and Leaf Water Potentials
Balancing pressures were measured using a custom-built Scholander pressure chamber with a digital gauge with 1 pounds per square inch. (6.9 kPa) resolution (DPG500; Omega Engineering). Xylem osmotic potentials were assumed to be negligible, allowing balancing pressures to serve as an estimate of both xylem and leaf water potential.
Leaf Hydraulic Vulnerability Curves
We used the conventional leaf rehydration technique (Brodribb and Holbrook, 2003) and a modified rehydration technique to study how decreases in leaf water potential affected Kleaf. In the conventional rehydration method, Kleaf is measured at the water potentials achieved after bench drying (Brodribb and Holbrook, 2003). In our modified protocol, each bench-dried sample was rehydrated to approximately −1 MPa and reequilibrated, prior to Kleaf measurement, by rehydration as above. Our goal was to distinguish between declines in Kleaf that were reversed simply by partial stress relaxation, to a level at which no depression of Kleaf was expected based on the standard rehydration vulnerability curve, versus those that were irreversible under the same conditions.
Terminal branches 1 to 1.5 m long were detached from the five study trees, transported to the laboratory within 10 min, and then allowed to dry to a range of water potentials on the laboratory bench. Before Kleaf measurements, branches were bagged and kept in the dark with a damp paper towel (contact between paper towel and leaves was avoided) for at least 2 h for water potential equilibrium of leaves. Small shoots approximately 7 to 10 cm long were placed in clear plastic bags with the opening sealed around the stem using Parafilm to minimize water loss during the measurement period. For the conventional method, Kleaf was measured at the water potential achieved by bench drying. Two prebagged shoots were used to determine the initial water potential (Ψo), and another adjacent prebagged shoot of similar size was cut from the branch under water and allowed to rehydrate for 90 s to 30 min depending on the Ψo. Rehydration times were managed to produce a water potential drop of approximately one-half of the Ψo to get a good resolution and to allow the data to be well fitted by the rehydration model (Rockwell et al., 2014). After rehydration, the cut ends were immediately blotted dry and wrapped with Parafilm, and the samples were placed in a second plastic bag for 1 h to allow water potential equilibrium of leaves and different tissues of the leaves. A preliminary study showed that this procedure of double bagging and cut end wrapping could keep T. baccata shoots for several hours without significant changes in water potential. After equilibrium, the final leaf water potential after rehydration was measured (Ψf). Kleaf was then calculated from the equation:
 |
(1) |
where C is the leaf capacitance and t is the rehydration time in seconds. This model can be expected to provide a consistent measure of conductance when the capacitance is downstream of the limiting resistance (Rockwell et al., 2014), as is expected both in the case of cavitation of the xylem and collapse of transfusion tracheids. Leaf C (mmol m−2 MPa−1) was measured as the average slope of the leaf pressure-volume relationship (Tyree and Hammel, 1972) for six shoots, normalized to leaf area (Brodribb and Holbrook, 2003). Leaf capacitances before and after TLP are distinctly different. Leaf capacitances above TLP (Cat) and below TLP (Cbt) were used for shoots with both Ψo and final leaf water potential above or below TLP, respectively. When the shoots were rehydrated over the TLP, a water potential-weighted Cw was calculated and used:
 |
(2) |
In the modified methods, after drying the big branches 1 to 1.5 m long to different water potentials, the branches were recut underwater and allowed to rehydrate to water potentials of approximately −1 MPa. The rehydration time varied from several minutes to 0.5 h depending on the Ψo for branches bench dried to water potentials less negative than −4 MPa. Branches bench dried to water potentials more negative than −4 MPa took 1 to 23 h to rehydrate to water potentials of approximately −1 MPa. After keeping the rehydrated branches in black plastic bags for about 1 h for water potential equilibration, Kleaf of different samples was determined according to the procedure described above.
To test whether rehydrating detached cavitated branches to 0 MPa results in cavitation refilling, five bench-dried branches (approximately −4.3 MPa) were rehydrated to approximately 0 MPa and kept fully rehydrated overnight. These branches were then bench dried to −1 MPa and their Kleaf was measured with shoots from these branches as described above.
Midday Leaf Water Potential and Leaf TLP
For midday leaf water potential measurement, 14 small sun-exposed shoots 7 to 10 cm long were collected from the five trees at 12:30 to 12:50 pm and kept in prehumidified zip bags and then in a cooler. Samples were transported to the laboratory in 10 min, and the water potentials were measured with the pressure chamber.
Leaf TLP was estimated from the leaf pressure-volume relationship (Tyree and Hammel, 1972). Small shoots approximately 7 to 10 cm long were obtained from sun-exposed branches cut in the field at dawn. Leaf water potential (ΨL) of the shoots was determined with the pressure chamber, and their fresh weights were measured immediately with a balance (CPA225D; Sartorius). Shoot samples were allowed to dehydrate slowly on the laboratory bench. Water potentials and fresh weight measurements were repeated frequently until the water potentials reached approximately −3.5 MPa. The saturated weight of each sample, used to calculate relative water content (RWC), was extrapolated as the weight at zero ΨL via a linear regression between sample fresh weight and ΨL above the TLP (Meinzer and Moore, 1988). The pressure-volume curves were obtained by plotting −1/ΨL against relative water deficit (RWD = 1 − RWC), and the TLP (osmotic potential at turgor loss) was calculated as the transition between the curvilinear fast-declining part and the linear part of the −1/ΨL versus RWD relationship (Tyree and Hammel, 1972).
Stem Hydraulic Vulnerability Curves
Stem hydraulic vulnerability curves were generated for big stems (diameter approximately 3.5 mm), small stems (approximately 2 mm), and terminal twigs with needles removed. Branches 1 to 1.5 m long were detached from the trees, transported to the laboratory within 10 min in black plastic bags, and then allowed to dry to a range of water potentials on the laboratory bench. After achieving its target water potential, each branch was enclosed in a plastic bag and kept in the dark with a damp paper towel for at least 2 h to allow water potentials of stems and leaves to equilibrate. The water potential of the branch was then measured on one or two excised shoots using the pressure chamber (two shoots were measured in the case of very low water potential branches to test equilibrium), and stem hydraulic conductivity (big and small stems) or hydraulic conductance (terminal twigs with needles removed) was measured. For the big stems, stem segments 6 to 10 cm long were cut under water and attached to a hydraulic conductivity apparatus (Sperry et al., 1988). The downstream ends of the stems were connected to tubing, and the flow rates were monitored using a balance (CPA225D; Sartorius). The water flow was generated by a hydraulic pressure head of 42 cm. Degassed and filtered (0.2 μm) 20-mmol KCl solution was used as the perfusion fluid for big stems, while degassed distilled water was used for small stems and terminal twigs with needles removed in order to be comparable with leaf hydraulic measurements. Hydraulic conductivity (Kh; kg m–1 s–1 MPa–1) was calculated as:
 |
(3) |
and hydraulic conductance (K) was calculated as:
 |
(4) |
where Jv is the flow rate through the stem segment (kg s–1; converted from mL s–1), ΔP is the pressure difference (MPa), and L is the length of the stem segment (m). Specific hydraulic conductivity (kg m–1 s–1 MPa–1) was obtained by normalizing Kh to the cross-sectional area of the active xylem. K was normalized by leaf area as measured by a LI-3100c leaf area meter (Li-Cor).
For the measurement of small stems and terminal twigs with needles removed, Jv was measured using a high-pressure flowmeter as described (Sack et al., 2002; Rockwell et al., 2011), because the flow rate generated by the static hydraulic pressure head was too low to be resolved with the balance. The pressure applied to the stems or twigs was approximately 0.05 MPa. These measurements were completed within 5 min to minimize the possibility of refilling embolism under positive pressures.
The potential for cutting under tension to depress xylem conductance (Wheeler et al., 2013) was assessed in big stems by constructing a second vulnerability curve in which xylem tensions were relaxed prior to excision of the measurement segment. For tension relaxation, bench-dried branches were recut under water and allowed to rehydrate to near zero (approximately −0.3 MPa) prior to sample excision.
CFM
CFM was used to detect the potential structural changes in xylem and transfusion tracheids. Branches 1 to 1.5 m long collected from the trees were supplied with 5% (w/v) acid fuchsin solution through their cut end overnight in the dark. The goal of this pretreatment was to stain the walls of the transfusion tracheids with a fluorescent dye, as the autofluorescence due to lignin in these cells was too weak to be detected in the frozen samples. The samples were bench dried to different water potentials and then placed in black plastic bags for at least 2 h for water potential equilibration, after which the water potentials were determined with the pressure chamber. Additionally, some bench-dried branches were rehydrated to 0 MPa with acid fuchsin to check whether the structural change was reversible. Individual needles were immersed and frozen in a bath of liquid nitrogen, cut in half while submerged in liquid nitrogen using a scalpel, and then leaf sections approximately 3 mm thick were quickly transported to an ethanol bath on a homemade cryo-stage. The cryo-stage was developed according to Cochard et al. (2004) with a few modifications. A 2.5- × 7.5-cm, 0.7-cm-thick copper plate was connected with a copper cable (0.3 cm in diameter) to a bath of liquid nitrogen in a Styrofoam cup. The length of the cable was adjusted to maintain the plate temperature at approximately −80°C. The temperature of the stage was monitored using a T-type thermocouple connected to a CR1000 data logger (Campbell Scientific). A 2-mm-thick well in the middle of the plate was filled with ethanol to prevent ice deposition on cross sections. Holes 3 mm deep were drilled in the middle of the well to orient and secure the samples. Leaf sections were examined at 10× magnification with an Olympus BH-2 fluorescence microscope and photographed using a digital camera (Axiocam; Zeiss). The samples were then thawed and rehydrated in distilled water for 2 to 3 h, stained with phloroglucinol/HCl, and viewed again with the fluorescence microscope. Images were analyzed using ImageJ (National Institutes of Health) to measure the areas of the xylem and transfusion tissue. The relative area of transfusion tracheids was calculated as the total area occupied by transfusion tracheids in the frozen state normalized by the total area occupied by transfusion tracheids observed in the same sample after thawing and rehydration.
CSEM
CSEM was used to confirm the dehydration-induced structural changes in transfusion tracheids revealed by CFM and to test whether the initial decline in Kleaf of the leaf hydraulic vulnerability curves results from cavitation. Branches 1 to 1.5 m long bench dried to different water potentials were then placed in black plastic bags for at least 2 h for water potential equilibration. Additionally, some bench-dried big branches were rehydrated to near 0 MPa. After water potential measurements with the pressure chamber, small shoots 15 to 20 cm long were removed from the branches, placed in plastic bags and then in a cooler, and transported to the Center for Nanoscale Systems at Harvard University for CSEM studies. Needles were frozen in a slurry bath of liquid nitrogen and fixed in a sample holder while remaining submerged in liquid nitrogen. The sample holder with samples was placed in a cryo-transfer chamber. After vacuum was achieved in the chamber, the samples were cryo-fractured to expose the vascular bundles including xylem and transfusion tissue in cross section. Then, the samples were etched for 5 or 12 min at −90°C and sputter coated with platinum at −130°C with a BAL-TEC MED020 Coating System (Balzers). Samples etched for 5 min were used to distinguish ice and air in the tracheids, while those etched for 12 min were used to examine wall structure. The samples within the cryo-chamber were transported to the chamber of a Zeiss NVision 40 Dual-Beam focused ion beam and scanning electron microscope with a cryogenic stage maintained at −160°C. Samples were viewed at either 2 or 3.5 kV.
Statistical Analysis
Leaf and stem vulnerability curves, as well as the response of the relative area of the transfusion tracheid region to water potential, were fitted with a sigmoid function: y = a + b/[1 + e−(x − c)/d]. One-way ANOVA was used to test the difference in Kleaf between samples rehydrated to −1 MPa and those rehydrated to 0 MPa and kept fully rehydrated overnight. Curves were fit using SigmaPlot version 12.5 (Systat Software), and one-way ANOVA was carried out in SPSS version 20 (IBM).
Acknowledgments
We thank Adam Graham and Nicholas Antoniou (Center for Nanoscale Systems of Harvard University) for assistance with CSEM. We also thank Dr. Hervé Cochard (INRA-Université Blaise Pascal) for helpful suggestions on building a cryo-stage for the fluorescence microscope.
Glossary
- Kleaf
leaf hydraulic conductance
- CSEM
cryo-scanning electron microscopy
- TLP
turgor loss point
- CFM
cryo-fluorescence microscopy
- Ψo
initial water potential
- ΨL
leaf water potential
Footnotes
This work was supported by the Air Force Office of Sponsored Research (grant no. FA9550–09–1–0188), the National Science Foundation (grant no. DMR–0820484), and the Sustainability Science Program at the Kennedy School of Government, Harvard University.
Articles can be viewed online without a subscription.
References
- Brodribb TJ, Cochard H. (2009) Hydraulic failure defines the recovery and point of death in water-stressed conifers. Plant Physiol 149: 575–584 [DOI] [PMC free article] [PubMed] [Google Scholar]
- Brodribb TJ, Holbrook NM. (2003) Stomatal closure during leaf dehydration, correlation with other leaf physiological traits. Plant Physiol 132: 2166–2173 [DOI] [PMC free article] [PubMed] [Google Scholar]
- Brodribb TJ, Holbrook NM. (2005) Water stress deforms tracheids peripheral to the leaf vein of a tropical conifer. Plant Physiol 137: 1139–1146 [DOI] [PMC free article] [PubMed] [Google Scholar]
- Brodribb TJ, Holbrook NM, Zwieniecki MA, Palma B. (2005) Leaf hydraulic capacity in ferns, conifers and angiosperms: impacts on photosynthetic maxima. New Phytol 165: 839–846 [DOI] [PubMed] [Google Scholar]
- Charra-Vaskou K, Badel E, Burlett R, Cochard H, Delzon S, Mayr S. (2012) Hydraulic efficiency and safety of vascular and non-vascular components in Pinus pinaster leaves. Tree Physiol 32: 1161–1170 [DOI] [PubMed] [Google Scholar]
- Chen JW, Zhang Q, Li XS, Cao KF. (2009) Independence of stem and leaf hydraulic traits in six Euphorbiaceae tree species with contrasting leaf phenology. Planta 230: 459–468 [DOI] [PMC free article] [PubMed] [Google Scholar]
- Choat B, Jansen S, Brodribb TJ, Cochard H, Delzon S, Bhaskar R, Bucci SJ, Feild TS, Gleason SM, Hacke UG, et al. (2012) Global convergence in the vulnerability of forests to drought. Nature 491: 752–755 [DOI] [PubMed] [Google Scholar]
- Cochard H, Barigah T, Herbert E, Caupin F. (2007) Cavitation in plants at low temperature: is sap transport limited by the tensile strength of water as expected from Briggs’ Z-tube experiment? New Phytol 173: 571–575 [DOI] [PubMed] [Google Scholar]
- Cochard H, Froux F, Mayr S, Coutand C. (2004) Xylem wall collapse in water-stressed pine needles. Plant Physiol 134: 401–408 [DOI] [PMC free article] [PubMed] [Google Scholar]
- Domec JC, Palmroth S, Ward E, Maier CA, Thérézien M, Oren R. (2009) Acclimation of leaf hydraulic conductance and stomatal conductance of Pinus taeda (loblolly pine) to long-term growth in elevated CO2 (free-air CO2 enrichment) and N-fertilization. Plant Cell Environ 32: 1500–1512 [DOI] [PubMed] [Google Scholar]
- Esau K (1977) Anatomy of Seed Plants, Ed 2. Wiley, New York [Google Scholar]
- Frank AB. (1864) Ein Beitrag zur Kenntniss der Gefässbündel. Botanische Zeitung 22: 165–174 [Google Scholar]
- Hacke UG, Sperry JS, Pittermann J. (2004) Analysis of circular bordered pit function. II. Gymnosperm tracheids with torus-margo pit membranes. Am J Bot 91: 386–400 [DOI] [PubMed] [Google Scholar]
- Hao GY, Hoffmann WA, Scholz FG, Bucci SJ, Meinzer FC, Franco AC, Cao KF, Goldstein G. (2008) Stem and leaf hydraulics of congeneric tree species from adjacent tropical savanna and forest ecosystems. Oecologia 155: 405–415 [DOI] [PubMed] [Google Scholar]
- Hils MH (1993) Taxaceae. In Flora of North America North of Mexico, Vol 2. Oxford University Press, New York, pp 423–427 [Google Scholar]
- Hu YS, Yao BJ. (1981) Transfusion tissue in gymnosperm leaves. Bot J Linn Soc 83: 263–272 [Google Scholar]
- Johnson DM, McCulloh KA, Meinzer FC, Woodruff DR, Eissenstat DM. (2011) Hydraulic patterns and safety margins, from stem to stomata, in three eastern U.S. tree species. Tree Physiol 31: 659–668 [DOI] [PubMed] [Google Scholar]
- Johnson DM, McCulloh KA, Woodruff DR, Meinzer FC. (2012a) Evidence for xylem embolism as a primary factor in dehydration-induced declines in leaf hydraulic conductance. Plant Cell Environ 35: 760–769 [DOI] [PubMed] [Google Scholar]
- Johnson DM, McCulloh KA, Woodruff DR, Meinzer FC. (2012b) Hydraulic safety margins and embolism reversal in stems and leaves: why are conifers and angiosperms so different? Plant Sci 195: 48–53 [DOI] [PubMed] [Google Scholar]
- Johnson DM, Meinzer FC, Woodruff DR, McCulloh KA. (2009a) Leaf xylem embolism, detected acoustically and by cryo-SEM, corresponds to decreases in leaf hydraulic conductance in four evergreen species. Plant Cell Environ 32: 828–836 [DOI] [PubMed] [Google Scholar]
- Johnson DM, Woodruff DR, McCulloh KA, Meinzer FC. (2009b) Leaf hydraulic conductance, measured in situ, declines and recovers daily: leaf hydraulics, water potential and stomatal conductance in four temperate and three tropical tree species. Tree Physiol 29: 879–887 [DOI] [PubMed] [Google Scholar]
- Kuo ML, Arganbright DG. (1978) SEM observation of collapse in wood. IAWA Bulletin 2-3: 40–46 [Google Scholar]
- McAdam SA, Brodribb TJ. (2014) Separating active and passive influences on stomatal control of transpiration. Plant Physiol 164: 1578–1586 [DOI] [PMC free article] [PubMed] [Google Scholar]
- McCulloh KA, Johnson DM, Meinzer FC, Woodruff DR. (2014) The dynamic pipeline: hydraulic capacitance and xylem hydraulic safety in four tall conifer species. Plant Cell Environ 37: 1171–1183 [DOI] [PubMed] [Google Scholar]
- Meinzer FC, Moore PH. (1988) Effect of apoplastic solutes on water potential in elongating sugarcane leaves. Plant Physiol 86: 873–879 [DOI] [PMC free article] [PubMed] [Google Scholar]
- Parker J. (1952) Desiccation in conifer leaves: anatomical changes and determination of the lethal level. Bot Gaz 114: 189–198 [Google Scholar]
- Rockwell FE, Holbrook NM, Stroock AD. (2014) Leaf hydraulics II: vascularized tissues. J Theor Biol 340: 267–284 [DOI] [PubMed] [Google Scholar]
- Rockwell FE, Holbrook NM, Zwieniecki MA. (2011) Hydraulic conductivity of red oak (Quercus rubra L.) leaf tissue does not respond to light. Plant Cell Environ 34: 565–579 [DOI] [PubMed] [Google Scholar]
- Roden JS, Canny MJ, Huang CX, Ball MC. (2009) Frost tolerance and ice formation in Pinus radiata needles: ice management by the endodermis and transfusion tissues. Funct Plant Biol 36: 180–189 [DOI] [PubMed] [Google Scholar]
- Sack L, Holbrook NM. (2006) Leaf hydraulics. Annu Rev Plant Biol 57: 361–381 [DOI] [PubMed] [Google Scholar]
- Sack L, Melcher PJ, Zwieniecki MA, Holbrook NM. (2002) The hydraulic conductance of the angiosperm leaf lamina: a comparison of three measurement methods. J Exp Bot 53: 2177–2184 [DOI] [PubMed] [Google Scholar]
- Scoffoni C, Vuong C, Diep S, Cochard H, Sack L. (2014) Leaf shrinkage with dehydration: coordination with hydraulic vulnerability and drought tolerance. Plant Physiol 164: 1772–1788 [DOI] [PMC free article] [PubMed] [Google Scholar]
- Sperry JS, Donnelly JR, Tyree MT. (1988) A method for measuring hydraulic conductivity and embolism in xylem. Plant Cell Environ 11: 35–40 [Google Scholar]
- Takeda H. (1913) A theory of ‘transfusion-tissue.’ Ann Bot (Lond) 27: 361–363 [Google Scholar]
- Tyree MT, Hammel HT. (1972) The measurement of the turgor pressure and the water relations of plants by the pressure-bomb technique. J Exp Bot 23: 267–282 [Google Scholar]
- von Mohl H (1871) Morphologische Betrachtung der Blätter von Sciadopitys. Bot Zeit 29: 17–23 [Google Scholar]
- Wheeler JK, Huggett BA, Tofte AN, Rockwell FE, Holbrook NM. (2013) Cutting xylem under tension or supersaturated with gas can generate PLC and the appearance of rapid recovery from embolism. Plant Cell Environ 36: 1938–1949 [DOI] [PubMed] [Google Scholar]
- Woodruff DR, McCulloh KA, Warren JM, Meinzer FC, Lachenbruch B. (2007) Impacts of tree height on leaf hydraulic architecture and stomatal control in Douglas-fir. Plant Cell Environ 30: 559–569 [DOI] [PubMed] [Google Scholar]
- Woodruff DR, Meinzer FC, Lachenbruch B. (2008) Height-related trends in leaf xylem anatomy and shoot hydraulic characteristics in a tall conifer: safety versus efficiency in water transport. New Phytol 180: 90–99 [DOI] [PubMed] [Google Scholar]
- Worsdell WC. (1897) VIII. On “Transfusion-tissue”: its origin and function in the leaves of gymnospermous plants. Transactions of the Linnean Society of London 2nd Series Botany 5: 301–319 [Google Scholar]
- Yang SJ, Zhang YJ, Sun M, Goldstein G, Cao KF. (2012) Recovery of diurnal depression of leaf hydraulic conductance in a subtropical woody bamboo species: embolism refilling by nocturnal root pressure. Tree Physiol 32: 414–422 [DOI] [PubMed] [Google Scholar]
- Zhang YJ, Meinzer FC, Hao GY, Scholz FG, Bucci SJ, Takahashi FS, Villalobos-Vega R, Giraldo JP, Cao KF, Hoffmann WA, et al. (2009) Size-dependent mortality in a Neotropical savanna tree: the role of height-related adjustments in hydraulic architecture and carbon allocation. Plant Cell Environ 32: 1456–1466 [DOI] [PubMed] [Google Scholar]


