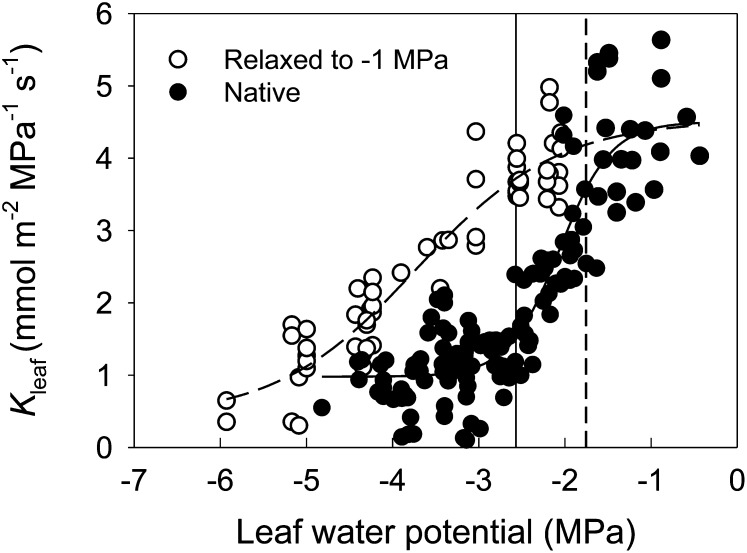
Figure 2.
Response of Kleaf to leaf water potential. Data were fitted with a sigmoid function (y = a + b/[1 + e−(x − c)/d]). Black circles are Kleaf measurements at water potentials reached by bench drying (conventional rehydration technique), and white circles are measurements after bench-dried samples were rehydrated to approximately −1 MPa. The solid vertical line indicates the leaf TLP, while the dashed line marks midday leaf water potential.

