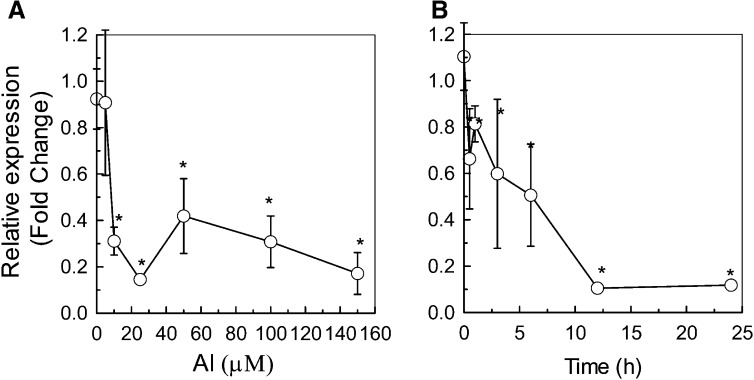
Figure 4.
Dose and time response of XTH17 RNA levels to Al in roots measured by quantitative RT-PCR analysis. A, XTH17 transcript levels in 6-week-old seedlings after exposure to 0 to 150 µm Al3+ for 24 h. B, XTH17 transcript levels after exposure to 25 µm Al for 0, 0.5, 1, 6, 12, and 24 h. The y axis shows XTH17 RNA levels normalized to that of the control (0 µm Al). Values are mean ± sd (n = 3). The asterisks show significant differences between control and Al treatments at P < 0.05 by Student’s t test.

